. 2012 Oct 12;151(2):289-303.
doi: 10.1016/j.cell.2012.09.016. Epub 2012 Sep 25.

A validated regulatory network for Th17 cell specification

Affiliations

A validated regulatory network for Th17 cell specification

Maria Ciofani et al. Cell. .

Erratum in

  • A Validated Regulatory Network for Th17 Cell Specification.
    Ciofani M, Madar A, Galan C, Sellars M, Mace K, Pauli F, Agarwal A, Huang W, Parkurst CN, Muratet M, Newberry KM, Meadows S, Greenfield A, Yang Y, Jain P, Kirigin FK, Birchmeier C, Wagner EF, Murphy KM, Myers RM, Bonneau R, Littman DR. Ciofani M, et al. Cell. 2025 Sep 23:S0092-8674(25)01083-9. doi: 10.1016/j.cell.2025.09.015. Online ahead of print. Cell. 2025. PMID: 40992377 No abstract available.

Abstract

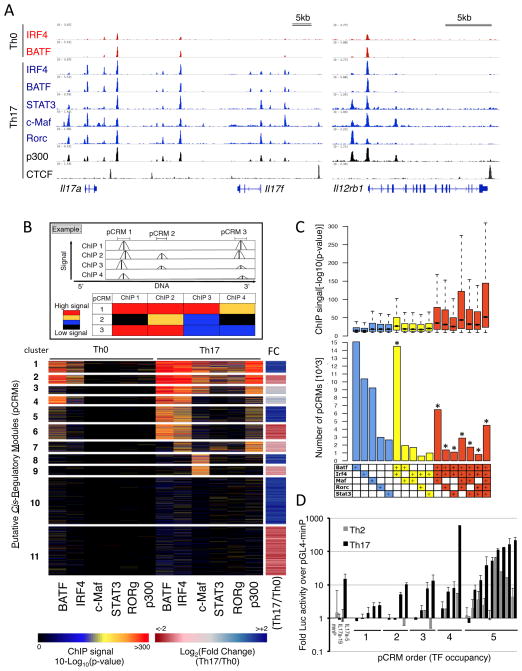
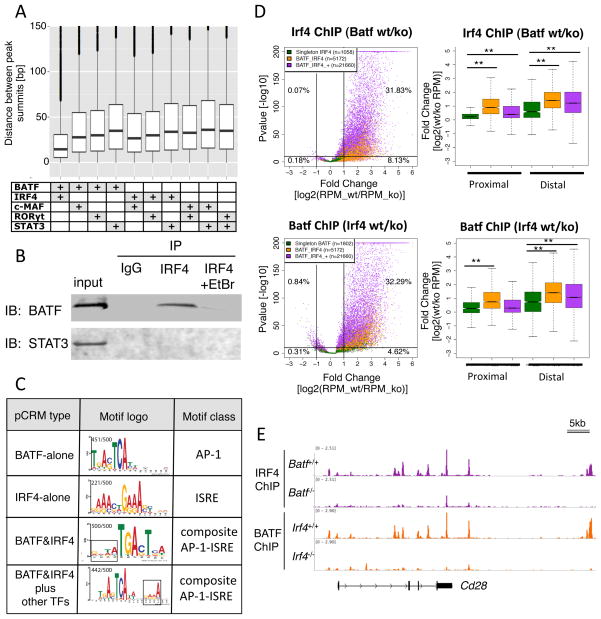
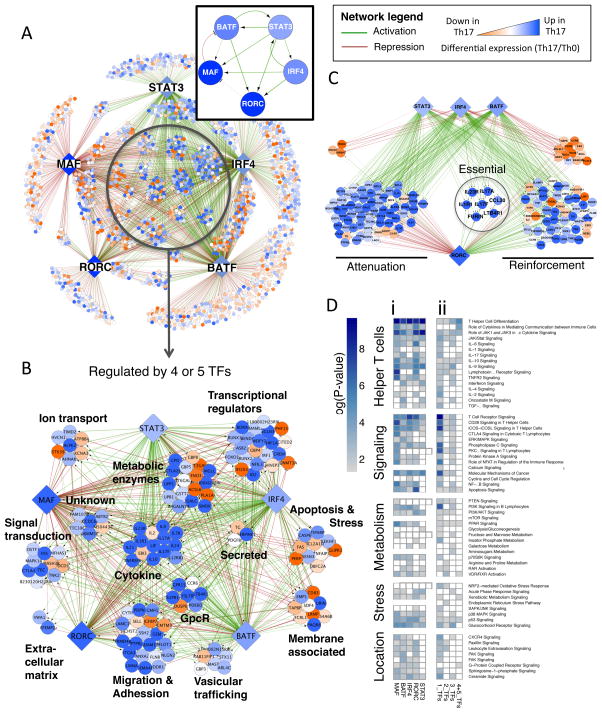
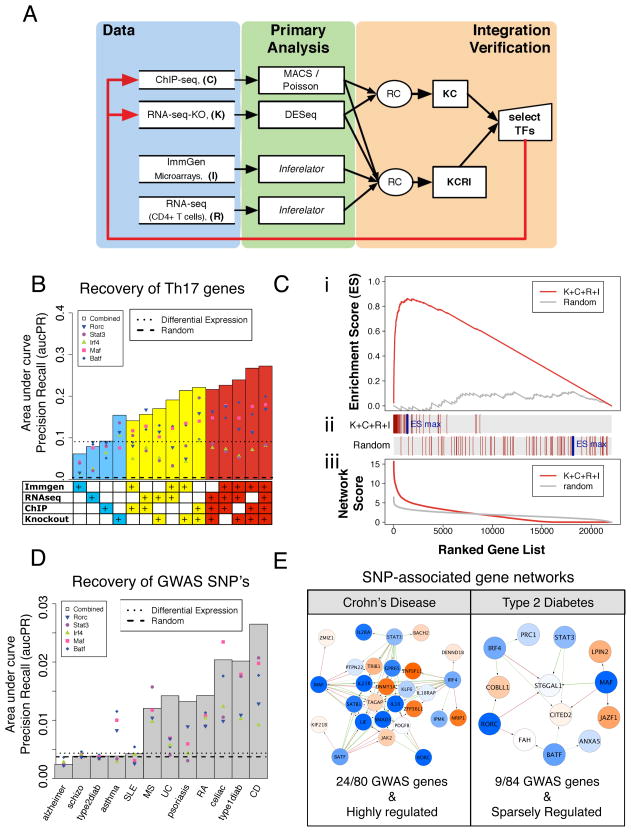
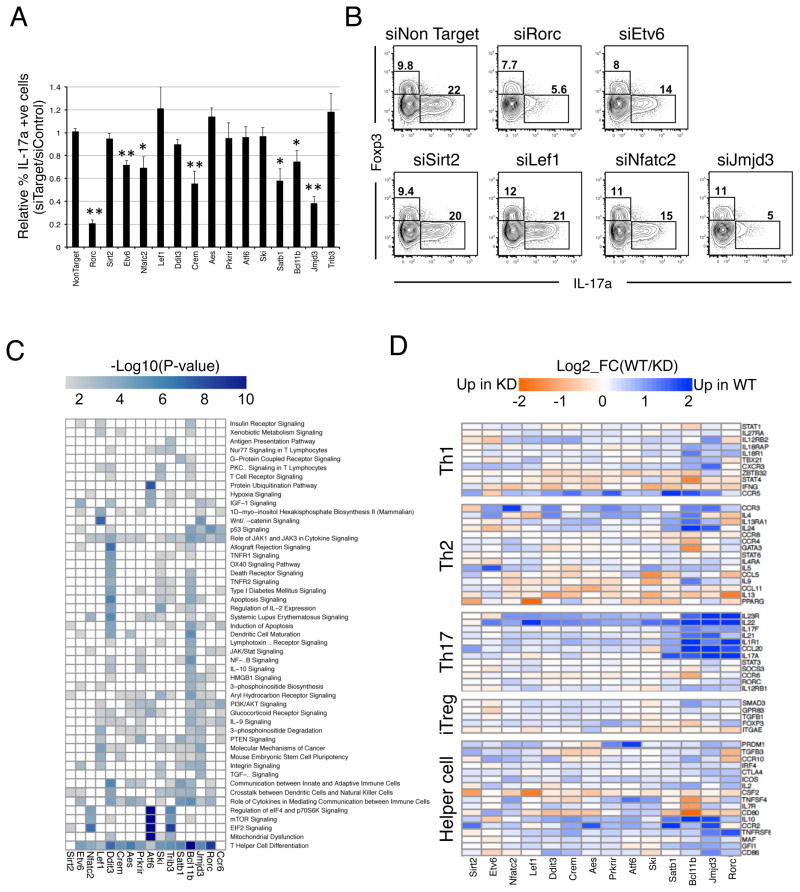
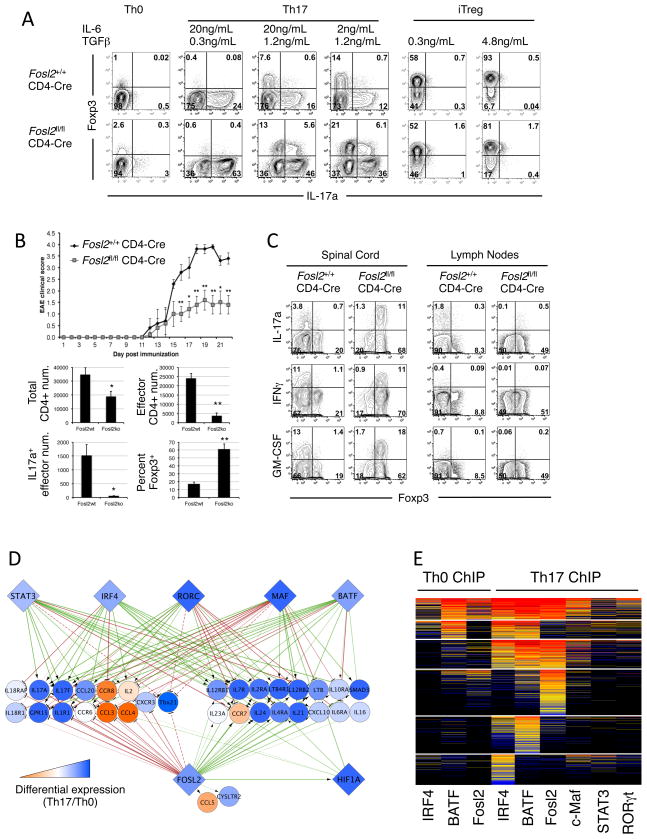
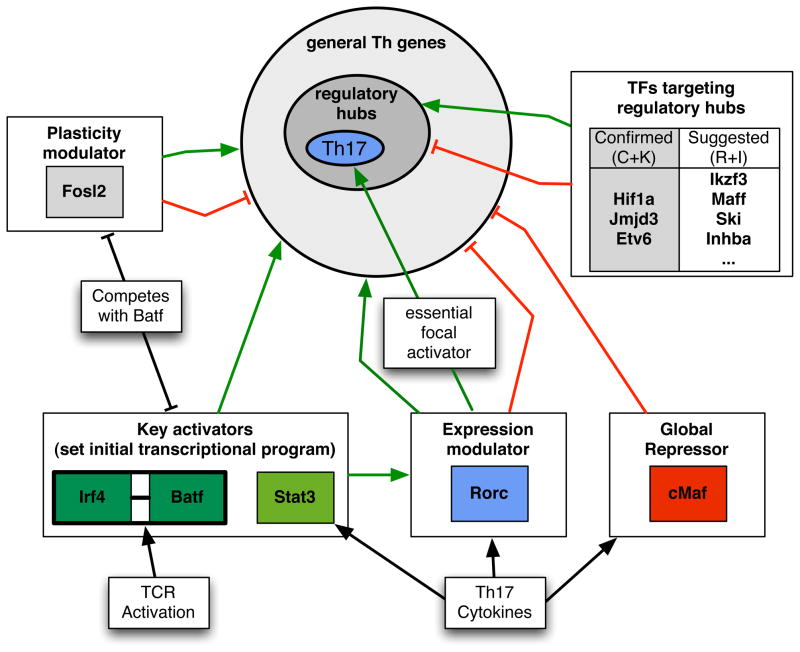
Th17 cells have critical roles in mucosal defense and are major contributors to inflammatory disease. Their differentiation requires the nuclear hormone receptor RORγt working with multiple other essential transcription factors (TFs). We have used an iterative systems approach, combining genome-wide TF occupancy, expression profiling of TF mutants, and expression time series to delineate the Th17 global transcriptional regulatory network. We find that cooperatively bound BATF and IRF4 contribute to initial chromatin accessibility and, with STAT3, initiate a transcriptional program that is then globally tuned by the lineage-specifying TF RORγt, which plays a focal deterministic role at key loci. Integration of multiple data sets allowed inference of an accurate predictive model that we computationally and experimentally validated, identifying multiple new Th17 regulators, including Fosl2, a key determinant of cellular plasticity. This interconnected network can be used to investigate new therapeutic approaches to manipulate Th17 functions in the setting of inflammatory disease.


Figures

Figure 1
Figure 1. Genome-wide co-occupancy of Th17 lineage TFs
A. ChIP-seq binding tracks for core TFs, p300, and CTCF at selected Th17 loci in Th0 and Th17 cells at 48h (visualized with IGV, Broad Institute). B. A clustered heat map of pCRM regions (rows) based on TF ChIP signals and the associated gene expression fold changes (FC) in Th17 vs. Th0 cells. A schematic illustration of the clustering approach is shown (top panel). C. Numbers of pCRMs with > 500 occurrences in Th17 cells (bottom) with associated distributions of TF ChIP p-values (top). Boxplots (top) show median (line), 25th to 75th percentile (box) ± 1.5 interquartile range. *denotes that we observed significantly more pCRMs than expected by chance based on 10000 simulations (P value <0.001). D. Luciferase reporter assay of enhancer activity for selected pCRM DNA regions in CD4 T cells cultured under Th2 and Th17 conditions. Y-axis: luciferase activity relative to that of pGL4-minP with a minimal promoter. X-axis: TF occupancy order of tested pCRMs (1 to 5 TFs); Il17a-5 and Il17a-19 serve as positive and negative controls, respectively. Error bars = SD of two experiments.
Figure 2
Figure 2. Cooperative occupancy by BATF and IRF4
A. Proximal binding of BATF and IRF4. Distribution of the distance between ChIP peak summits for pairs of TFs in 5-TF pCRMs. Boxplot: as in Figure 1; points=outliers. B. Co-immunoprecipitation of BATF, but not STAT3, with IRF4 in 48h Th17-polarized cultures. Ethidium bromide (EtBr) disrupts DNA-protein interactions. IP: immunoprecipitating antibody; IB: immunoblotting antibody. Representative of two experiments. C. MEME-ChIP motifs identified in 4 sub-types of pCRMs as indicated. The AP-1 and ISRE consensus is recovered in regions singly occupied by BATF, and IRF4, respectively. A new AP-1-ISRE composite motif comprising an AP-1 site (TGA(C/G)TCA) adjacent to an ISRE half site (GAAA; boxed region) is only recovered at pCRMs occupied by BATF and IRF4. ISRE half site orientation differs according to whether or not there is a 4bp interval. The fraction of pCRMs for which the motif is found is indicated. D. Genome-wide interdependence of IRF4 and BATF co-occupancy in Th17-polarized cells. Scatter plots display the fold change in ChIP-seq reads vs. significance. Top: IRF4 in Batf wt vs. KO. Bottom: BATF in Irf4 wt vs. KO. Differences in ChIP-Seq reads displayed for 3 relevant pCRM sub-types: BATF or IRF4 alone (green); BATF and IRF4 (orange); and BATF, IRF4, plus additional TFs (purple). Distribution of fold changes of wt vs. KO occupancy are displayed for proximal and distal pCRMs; boxplots as in Figure 1C. RPM; reads per million. ** Significant at P-value<0.001, Kolmogorov-Smirnov test. E. Reciprocally reduced occupancy of BATF and IRF4 at the Cd28 locus in Th17-polarized cells deficient for IRF4 and BATF, respectively. ChIP-seq tracks were normalized for library size.
Figure 3
Figure 3. TF combinatorial interactions specify the Th17 lineage
A. High confidence regulatory edges (FDR<10%; based on 10,000 simulations) focused on five core TFs identify direct (ChIP-seq) and functional (KO RNA-seq) regulatory targets (visualized using Cytoscape). Boxed inset displays the regulatory interactions between core Th17 TFs. See network legend for visualization scheme. B. Expanded view of highly regulated nodes with four to five core regulatory inputs, grouped based on general functional categories. C. Regulatory interactions shared by STAT3, IRF4, BATF, and RORγt highlighting different aspects of RORγt transcriptional function. Attenuation: RORγt repression targets that are up-regulated in Th17 cells; Reinforcement: Activation targets that are up-regulated in Th17 cells; Essential: targets having a two-fold change in RORγt KO differential expression and KO H3K4me3 ChIP. D. Targets for single TFs are enriched for pathways in multiple functional categories (i). Targets of multiple TFs (increasingly regulated by 2, 3, or 4+5 TFs) are selectively enriched for pathways related to T helper differentiation and effector function (ii). Analysis performed using the Ingenuity analysis tool (IPA) is presented as a heat map of enrichment p-values.
Figure 4
Figure 4. Network model performance and validation
A. Schematic for integration of four genomics and systems data types (K, C, R, and I) using a rank combined (RC) approach, resulting in the KC and KCRI networks. B. Performance measured as aucPR values indicating enrichment of literature-curated Th17 genes in networks derived from all possible data combinations. Points indicate single TF predictions (e.g. BATFtarget) and bars indicate TF sum predictions (i.e. [BATF+IRF4+STAT3+MAF+RORγt]target). Dotted line, reference performance for targets prioritized by differential expression (Th17 vs. Th0) and, dashed line, for random. C. Gene Set Enrichment Analysis (GSEA, Broad Institute) for the top-performing KCRI network. (i) The ranked list of TF sum targets recovers Th17-relevant genes with a maximal enrichment score (ES) of 0.86 out of 1 (red line); random (gray line). (ii) Vertical red lines indicate where in the ranked list literature-derived genes were recovered. (iii) Summed TF score distributions for KCRI (red line) and random (gray line). D. The KCRI network selectively recovers GWAS SNP-linked genes for Th17-implicated inflammatory diseases. Recovery of SNP-associated disease genes is measured in terms of aucPR for TF sum predictions (gray bars) and single TF predictions (points). E. Core TF networks for genes associated with GWAS of Crohn’s disease and Type 2 Diabetes. The KCRI network recovered 24 out of 80 Crohn’s disease genes (p-val=10−7), and 9 out of 84 Type 2 Diabetes genes (p-val=0.29). Network display is as in Figure 3. P-values calculated by Fisher’s exact test.
Figure 5
Figure 5. Identification of novel Th17 regulators
A. siRNA knock-down screen of candidate TF function in Th17 differentiation. Percent of IL17A-producing cells relative to the control siRNA condition for knock-down cultures analyzed at 24h of Th17 polarization. Error bars = SD of two experiments conducted in triplicate. *P<0.05 and **P<0.01, T-test. B. Flow cytometric analysis for Th17-polarized cells transfected with siRNAs for the indicated gene targets. C. Shared and unique functions of novel Th17 TF regulators. Heat map of Ingenuity pathway enrichment (IPA, p-value<0.01) for candidate TF-dependent genes. D. TF candidates influence the expression of immune-modulatory genes. Heat map of log2 fold change in expression of T helper signature genes in the siRNA knock-downs relative to non-targeting control for 24h Th17 polarization cultures.
Figure 6
Figure 6. Fosl2 regulates loci critical to lineage identity and function
A. Fosl2 negatively regulates IL-17A expression. Flow cytometric analysis for naïve Fosl2 wt and KO CD4 T cells cultured as indicated for 3 days. Representative of 4 experiments. B. Conditional deficiency of Fosl2 in CD4 T cells reduces the severity of EAE. Top panel shows clinical scores (mean ± s.e.m.) for CD4-cre mice with wt or conditional Fosl2 alleles (*P<0.05 and **P<0.01, T-test). Bottom panel displays total numbers or percentages of CD4+ T cell populations isolated from spinal cord (mean ± s.e.m.). Effector CD4+ T cells are defined as Foxp3. Representative of two experiments. C. Predominance of cytokine-producing Foxp3+ cells in mice during EAE. Flow cytometric analysis of re-stimulated CD4+ T cells isolated from the spinal cord and lymph nodes of mice on day 22 post EAE induction. Plots gated CD4+CD45+ cells. D. Combinatorial core TF targets involved in T cell specification are highly regulated by Fosl2. Network depiction is as in Figure 3. Dashed lines: edges added manually to account for Tbx21 with ChIP peaks outside of the set boundaries (10kb flanking the transcribed region). E. The clustered heat map of Fosl2 and core TF occupancy reveals that the binding domain of Fosl2 largely overlaps with that of BATF.
Figure 7
Figure 7. Model for Th17 TF functions during lineage specification
Functions of the core TFs and a selection of newly-identified TFs in regulating expression of general T-helper cell- and Th17 cell-associated genes. BATF/IRF4 complexes, transcriptionally induced following TCR signaling, mutually activate the expression of a large set of target genes, together with STAT3. RORγt drives expression of a small subset of key Th17 genes and modulates the expression of genes activated by initiator TFs, BATF/IRF4/STAT3. Fosl2 restricts the expression of genes required for alternate CD4+ differentiation programs. c-Maf functions as a general repressor. Regulatory hubs include loci that receive a high level of input from Th17 TFs and are enriched for genes that are critical for Th17 differentiation and function.

Comment in

References

    1. Alam MS, Maekawa Y, Kitamura A, Tanigaki K, Yoshimoto T, Kishihara K, Yasutomo K. Notch signaling drives IL-22 secretion in CD4+ T cells by stimulating the aryl hydrocarbon receptor. Proc Natl Acad Sci U S A. 2010;107:5943–5948. - PMC - PubMed
    1. Bauquet AT, Jin H, Paterson AM, Mitsdoerffer M, Ho IC, Sharpe AH, Kuchroo VK. The costimulatory molecule ICOS regulates the expression of c-Maf and IL-21 in the development of follicular T helper cells and TH-17 cells. Nat Immunol. 2009;10:167–175. - PMC - PubMed
    1. Bonneau R, Facciotti MT, Reiss DJ, Schmid AK, Pan M, Kaur A, Thorsson V, Shannon P, Johnson MH, Bare JC, et al. A predictive model for transcriptional control of physiology in a free living cell. Cell. 2007;131:1354–1365. - PubMed
    1. Brustle A, Heink S, Huber M, Rosenplanter C, Stadelmann C, Yu P, Arpaia E, Mak TW, Kamradt T, Lohoff M. The development of inflammatory T(H)-17 cells requires interferon-regulatory factor 4. Nat Immunol. 2007;8:958–966. - PubMed
    1. Califano A, Butte AJ, Friend S, Ideker T, Schadt E. Leveraging models of cell regulation and GWAS data in integrative network-based association studies. Nat Genet. 2012;44:841–847. - PMC - PubMed

Publication types

MeSH terms

Substances

Associated data