. 2012 Dec;41(6):1959-66.
doi: 10.3892/ijo.2012.1641. Epub 2012 Sep 26.

Cell type and context-specific function of PLAG1 for IGF2 P3 promoter activity

Affiliations

Cell type and context-specific function of PLAG1 for IGF2 P3 promoter activity

Monira Akhtar et al. Int J Oncol. 2012 Dec.

Abstract

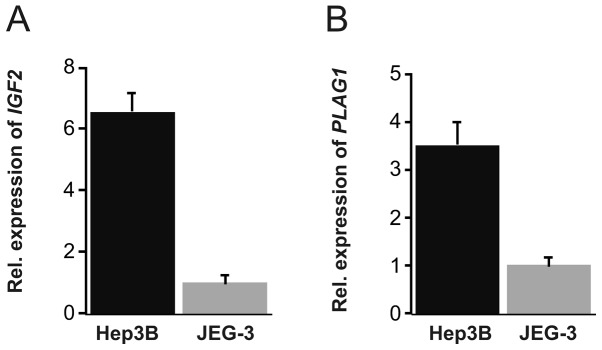
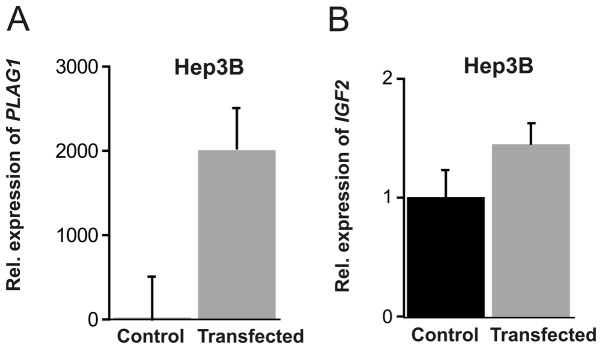
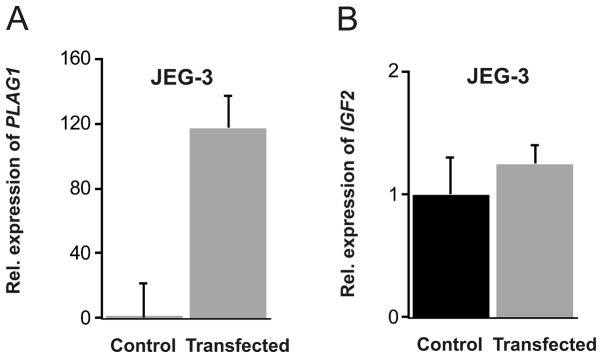
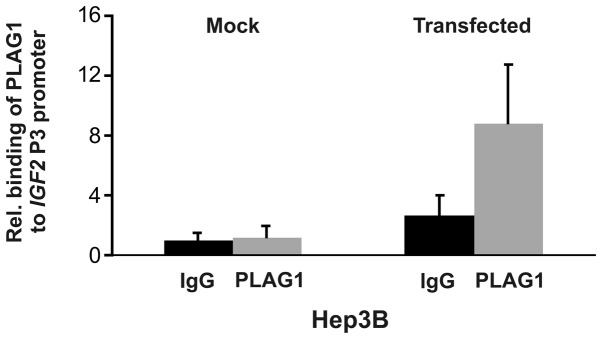
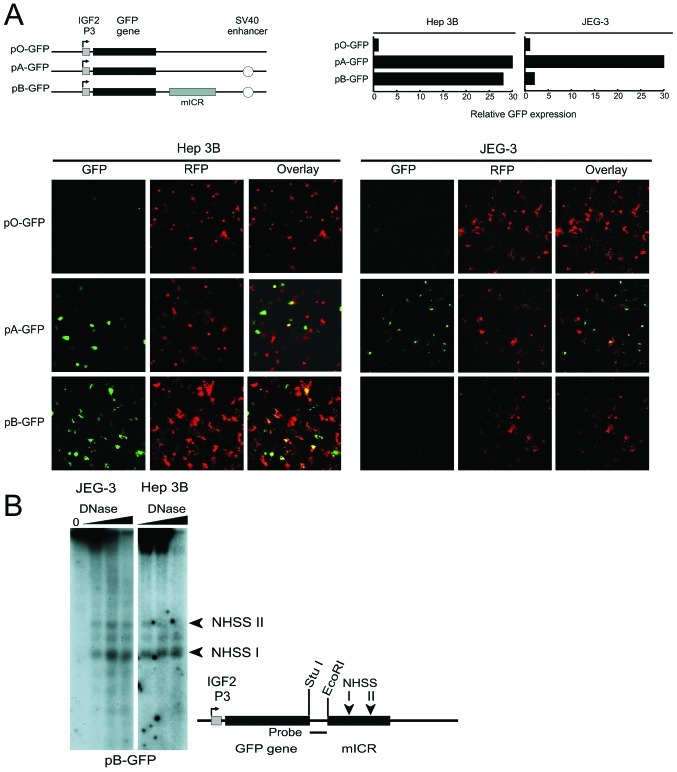
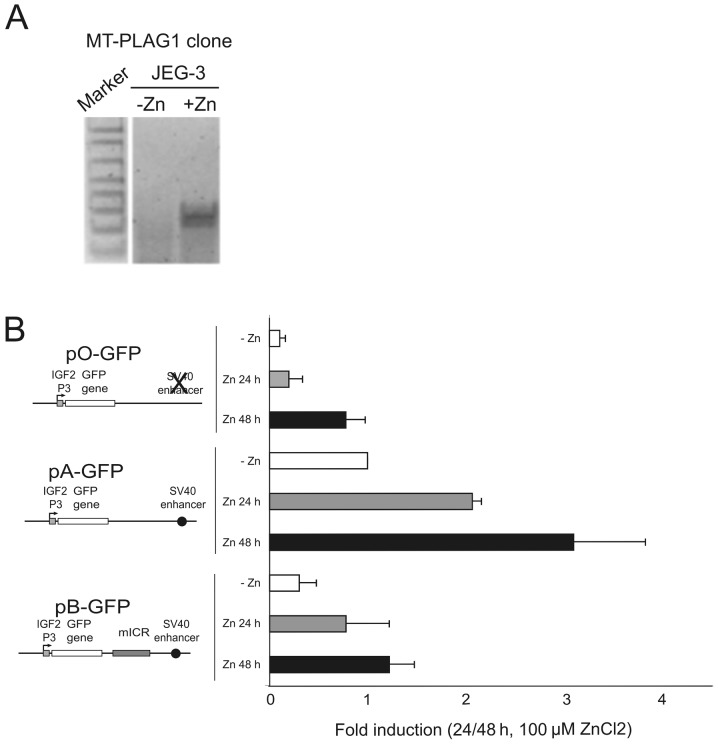
The fetal transcription factor PLAG1 is found to be overexpressed in cancers, and has been suggested to bind the insulin like growth factor 2 (IGF2) P3 promoter, and to activate the IGF2 gene. The expression of IGF2 has partly been linked to loss of CTCF-dependent chromatin insulator function at the H19 imprinting control region (ICR). We investigated the role of PLAG1 for IGF2 regulation in Hep3B and JEG-3 cell lines. Chromatin immunoprecipitation revealed cell type-specific binding of PLAG1 to the IGF2 P3 promoter, which was substantially insensitive to recombinant PLAG1 overexpression in the endogenous context. We hypothesized that the H19 chromatin insulator may be involved in the cell type-specific PLAG1 response. By using a GFP reporter gene/insulator assay plasmid construct with and without the H19 ICR and/or an SV40 enhancer, we confirm that the effect of the insulator is specifically associated with the activity of the IGF2 P3 promoter in the GFP reporter system, and furthermore, that the reporter insulator is functional in JEG-3 but not in Hep3B cells. FACS analysis was used to assess the function of PLAG1 in low endogenously expressing, but Zn-inducible stable PLAG1 expressing JEG-3 cell clones. Considerable increase in IGF2 expression upon PLAG1 induction with a partial insulator overriding activity was found using the reporter constructs. This is in contrast to the effect of the endogenous IGF2 gene which was insensitive to PLAG1 expression in JEG-3, while modestly induced the already highly expressed IGF2 gene in Hep3B cells. We suggest that the PLAG1 binding to the IGF2 P3 promoter and IGF2 expression is cell type-specific, and that the PLAG1 transcription factor acts as a transcriptional facilitator that partially overrides the insulation by the H19 ICR.


Figures

Figure 1
Figure 1
Detection of IGF2 and PLAG1 transcripts in Hep3B and JEG-3 cells. (A) qRT-PCR analysis of the relative expression level of IGF2 mRNA. (B) Real-time qPCR analysis of PLAG1 mRNA. All experiments were run in triplicate. Error bars denote standard error of the mean.
Figure 2
Figure 2
Detection of IGF2 and PLAG1 expression in Hep3B cells following transfection with the PLAG1 expression vector, pCAGGS-PLAG1. Cells were harvested 72 h post-transfection. (A) PLAG1 transcripts relative to mock transfected control. (B) IGF2 transcript after PLAG1 overexpression, relative to mock transfected control. The experiments were run in triplicate. Error bars denote standard error of the mean.
Figure 3
Figure 3
Detection of IGF2 and PLAG1 expression in JEG-3 cells following transfection with the PLAG1 expression vector, pCAGGS-PLAG1. Cells were harvested 72 h post-transfection. (A) PLAG1 transcripts relative to mock transfected control. (B) IGF2 transcripts after PLAG1 overexpression, relative to mock transfected control. The experiments were run in triplicate. Error bars denote standard error of the mean.
Figure 4
Figure 4
Analyses of PLAG1 binding at the IGF2 P3 promoter in Hep3B cells as determined by ChIP. Chromatin fragments were immunoprecipitated with anti-PLAG1 antibody and IgG as a control, and quantified by SYBR-Green qPCR. The ChIP analyses were run in triplicate and error bars denote standard error of the mean.
Figure 5
Figure 5
The insulator function of the ICR can be bypassed in human cancer cells and correlates to levels of PLAG1 expression. (A) Schematic illustrations of the GFP reporter constructs used in the insulator assays. The analysis of GFP expression was performed using flow cytometry (upper right) where the bars depicts relative GFP expression after correlation to RFP expression (pRep9RFP) and with confocal microscopy where the panels show the GFP expression pattern of the different reporter genes in a subset of cells in Hep3B and JEG-3. The left sections show GFP expression in the construct. The middle section of each panel shows the expression of the transfection control construct, DsRed2. The right sections show an overlay, where the distinctive GFP and RFP expression pattern can be determined. (B) The chromatin conformation of the transfected ICR is similar in both GFP expressing and non-expressing cells. DNase I-treated nuclei from JEG-3 and Hep3B transfected with pB-GFP, was digested with StuI. The nuclease hypersensitive sites (NHSS I and II) correspond to CTCF target sites [Kanduri et al(23)] and are identical in both cell lines.
Figure 6
Figure 6
Expression analyses of JEG-3 cells in a stable MT-PLAG1 clone and subsequent transient IGF2-P3-GFP transfection. (A) Semi-quantitative RT-PCR analysis showing increased PLAG1 expression in the Zn-treated MT-PLAG1 JEG-3 clone (+Zn) as compared to untreated cells (−Zn). B. The MT-PLAG1 JEG-3 cell-clone was transfected with IGF2-P3-GFP reporter constructs and analysis of GFP expression was performed using flow cytometry. The bars depict relative GFP expression after correlation to RFP expression (DsRed2) and indicate fold induction of GFP expression with non-induced (−Zn) and induced (+Zn) PLAG1 expression with different reporter constructs. The expression levels of GFP was analysed after both 24 and 48 h, showing an increased level of GFP expression after 48 h of induction. The expression level of the non-induced pA-GFP construct is set at 1 and is referred to as the basic state of enhanced expression. The error bars denote the SEM of three independent experiments.

References

    1. LeRoith D, Roberts CT., Jr The insulin-like growth factor system and cancer. Cancer Lett. 2003;195:127–137. - PubMed
    1. Cui H. Loss of imprinting of IGF2 as an epigenetic marker for the risk of human cancer. Dis Markers. 2007;23:105–112. - PMC - PubMed
    1. Cui H, Cruz-Correa M, Giardiello FM, et al. Loss of IGF2 imprinting: a potential marker of colorectal cancer risk. Science. 2003;299:1753–1755. - PubMed
    1. Feinberg AP, Cui H, Ohlsson R. DNA methylation and genomic imprinting: insights from cancer into epigenetic mechanisms. Semin Cancer Biol. 2002;12:389–398. - PubMed
    1. Ohlsson R, Kanduri C, Whitehead J, Pfeifer S, Lobanenkov V, Feinberg AP. Epigenetic variability and the evolution of human cancer. Adv Cancer Res. 2003;88:145–168. - PubMed

Publication types