. 2012 Sep 25;11(4):Article 15.
doi: 10.1515/1544-6115.1796.

A new explained-variance based genetic risk score for predictive modeling of disease risk

Affiliations

A new explained-variance based genetic risk score for predictive modeling of disease risk

Ronglin Che et al. Stat Appl Genet Mol Biol. .

Abstract

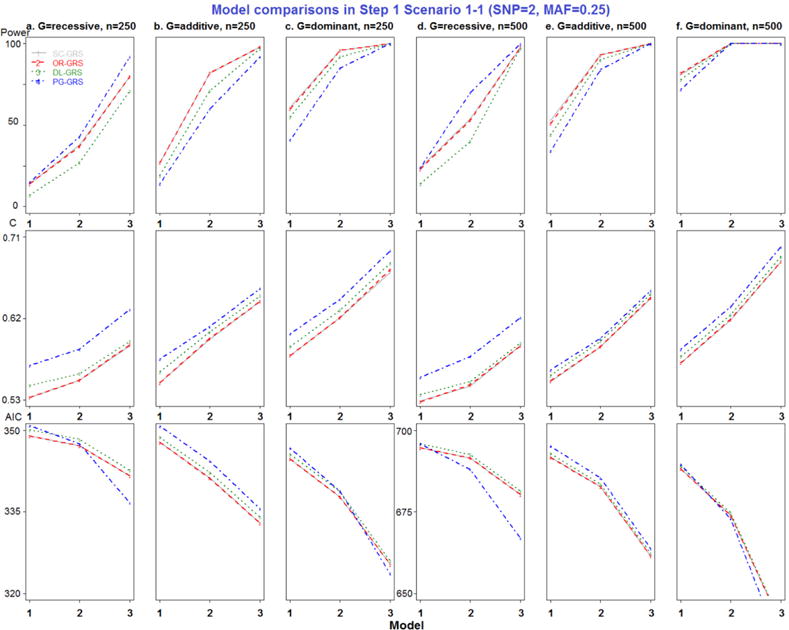
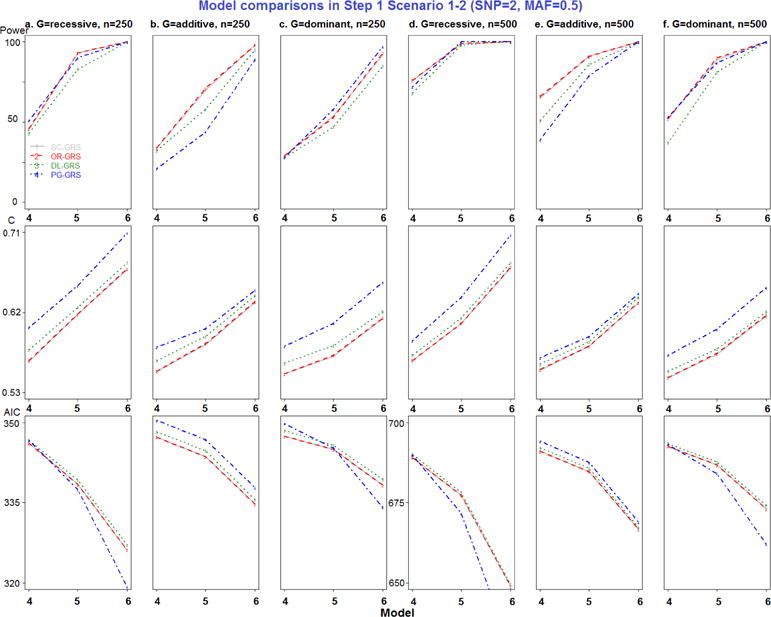
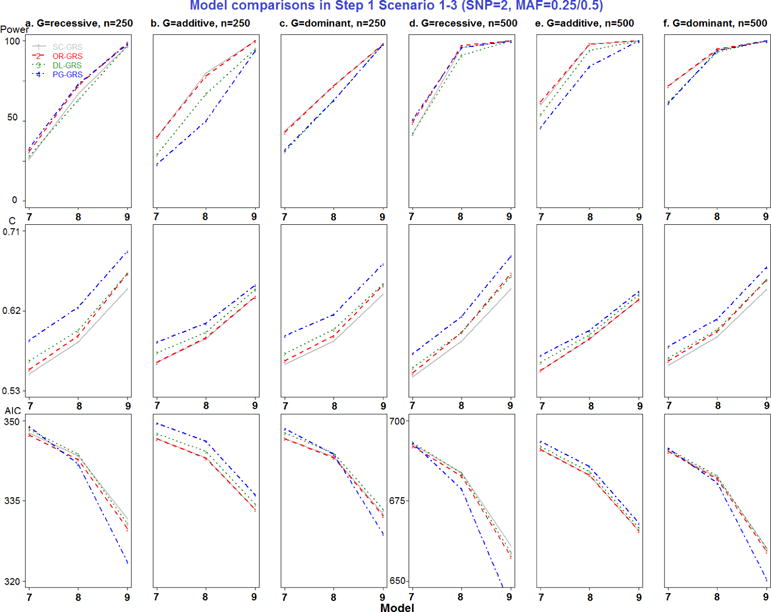
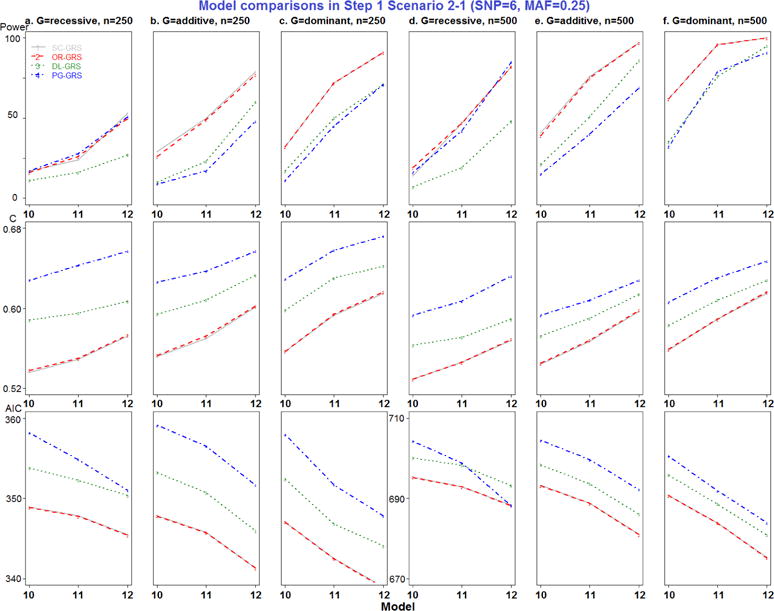
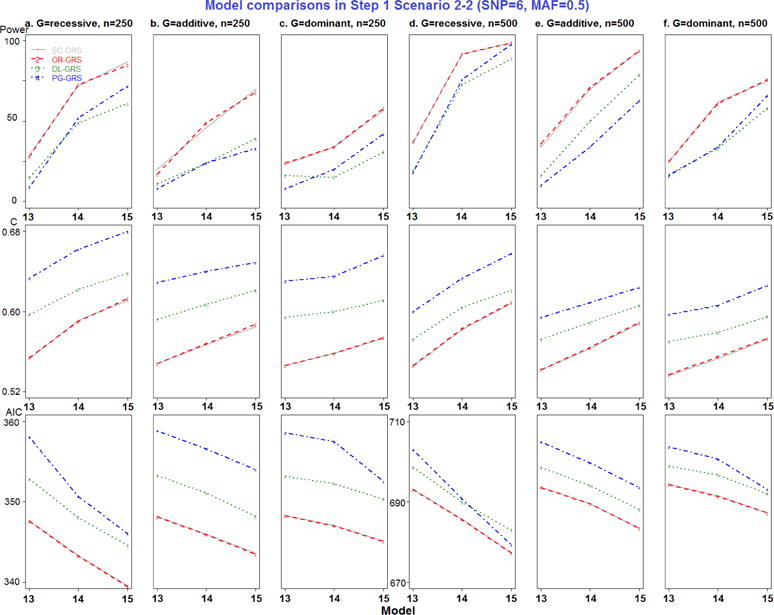
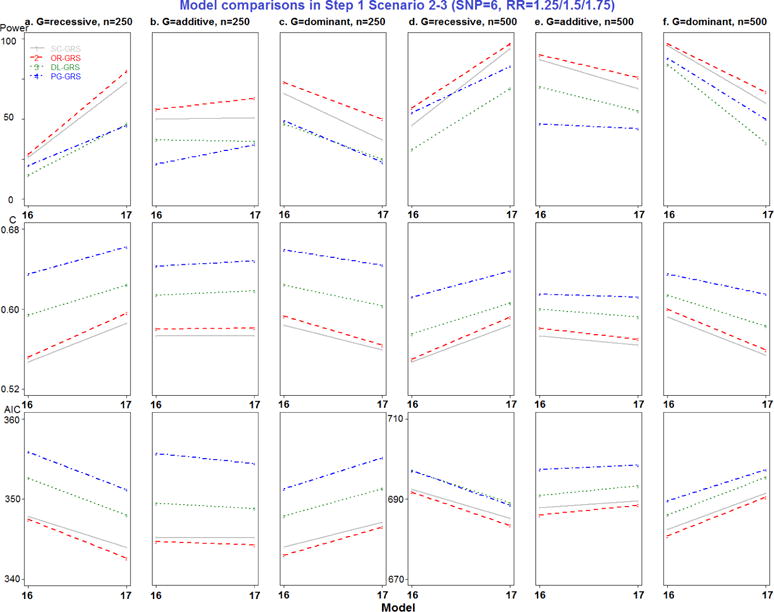
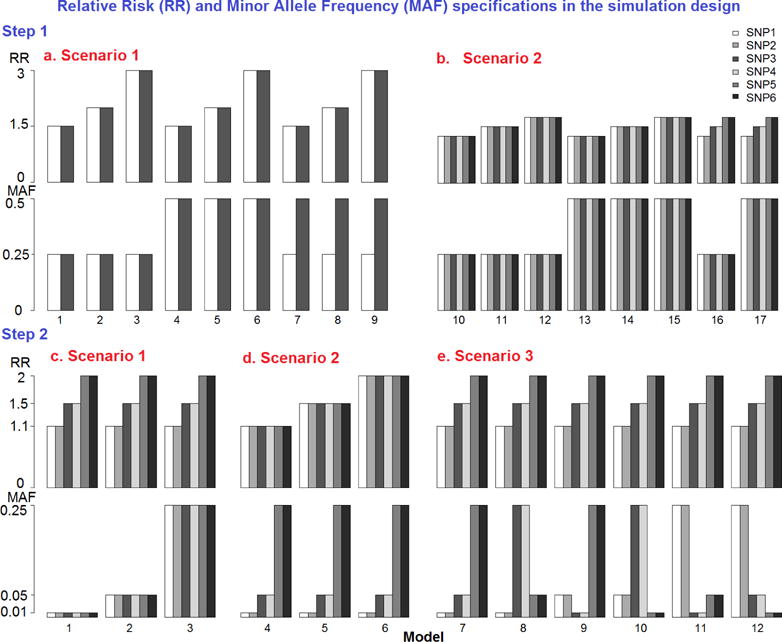
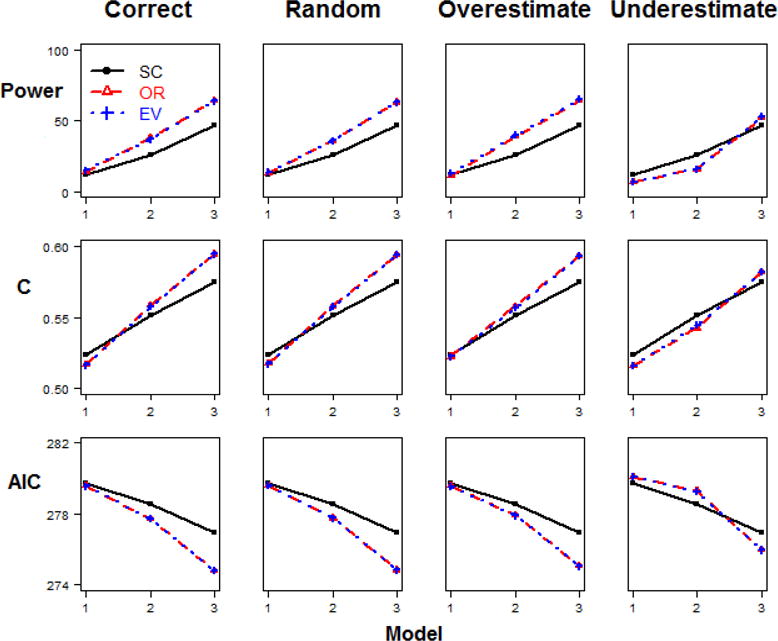
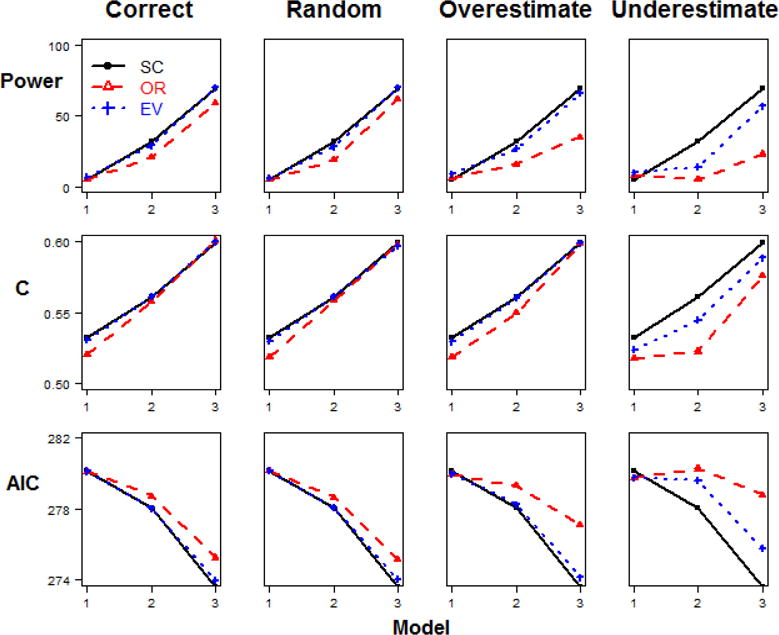
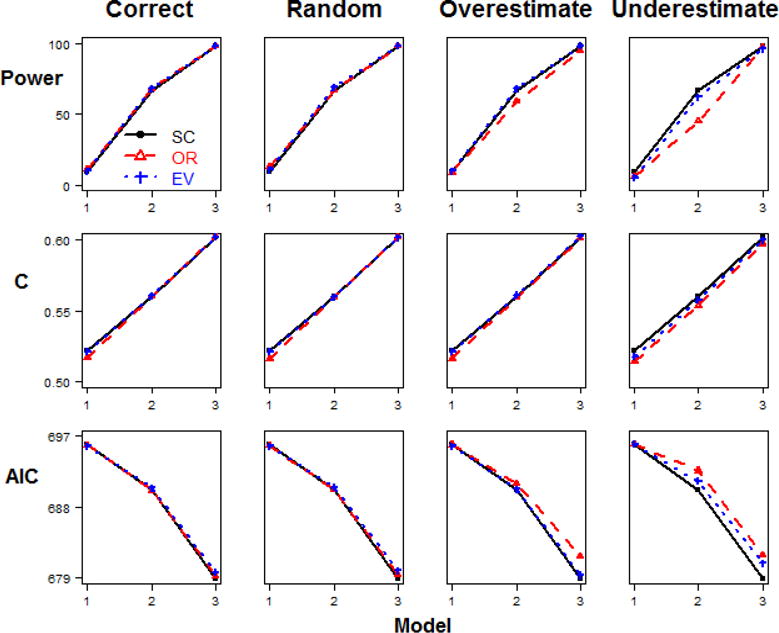
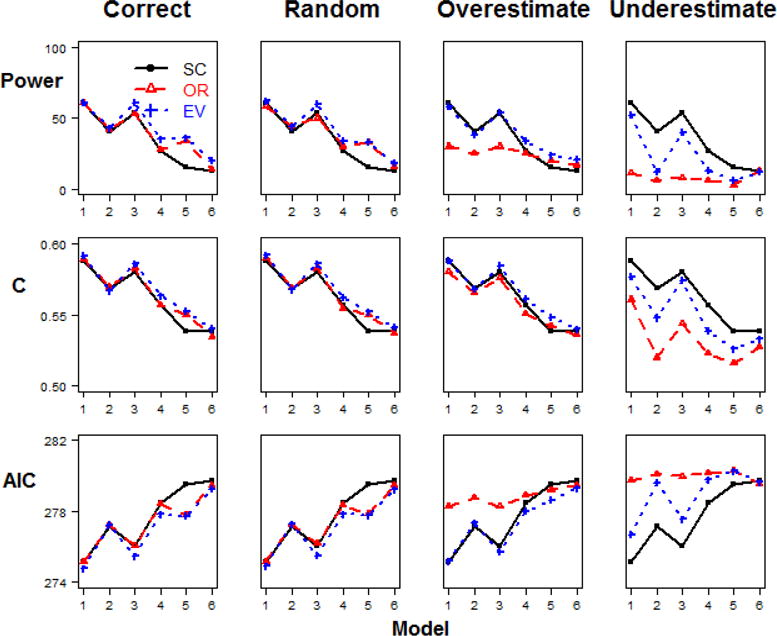
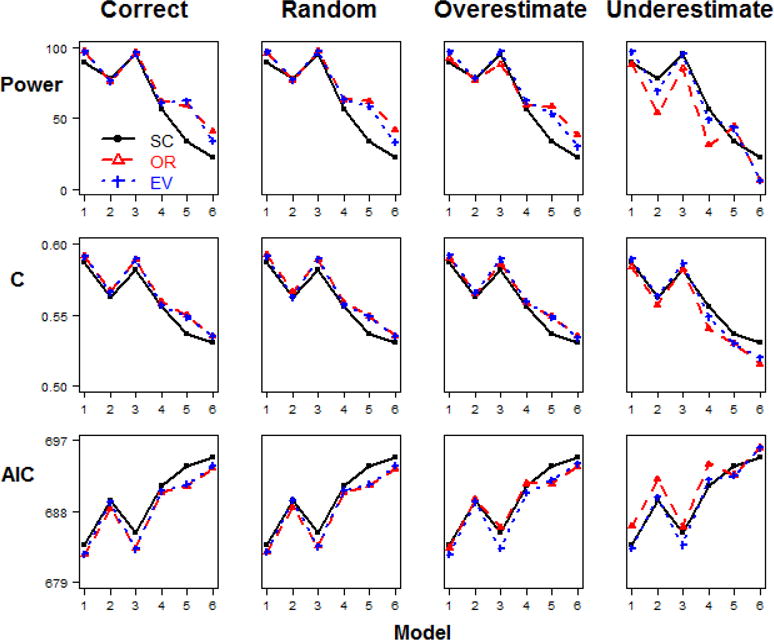
The goal of association mapping is to identify genetic variants that predict disease, and as the field of human genetics matures, the number of successful association studies is increasing. Many such studies have shown that for many diseases, risk is explained by a reasonably large number of variants that each explains a very small amount of disease risk. This is prompting the use of genetic risk scores in building predictive models, where information across several variants is combined for predictive modeling. In the current study, we compare the performance of four previously proposed genetic risk score methods and present a new method for constructing genetic risk score that incorporates explained variance information. The methods compared include: a simple count Genetic Risk Score, an odds ratio weighted Genetic Risk Score, a direct logistic regression Genetic Risk Score, a polygenic Genetic Risk Score, and the new explained variance weighted Genetic Risk Score. We compare the methods using a wide range of simulations in two steps, with a range of the number of deleterious single nucleotide polymorphisms (SNPs) explaining disease risk, genetic modes, baseline penetrances, sample sizes, relative risks (RR) and minor allele frequencies (MAF). Several measures of model performance were compared including overall power, C-statistic and Akaike's Information Criterion. Our results show the relative performance of methods differs significantly, with the new explained variance weighted GRS (EV-GRS) generally performing favorably to the other methods.


Figures

Figure 1
Figure 1
Model comparisons in Step 1 Scenario 1-1 (SNP=2, MAF=0.25).
Figure 2
Figure 2
Model comparisons in Step 1 Scenario 1-2 (SNP=2, MAF=0.5).
Figure 3
Figure 3
Model comparisons in Step 1 Scenario 1-3 (SNP=2, MAF=0.25/0.5).
Figure 4
Figure 4
Model comparisons in Step 1 Scenario 2-1 (SNP=6, MAF=0.25).
Figure 5
Figure 5
Model comparisons in Step 1 Scenario 2-2 (SNP=6, MAF=0.5).
Figure 6
Figure 6
Model comparisons in Step 1 Scenario 2-3 (SNP=6, RR=1.25/1.5/1.75).
Figure 1
Figure 1
Relative risk and minor allele frequency specifications in the simulation design.
Figure 2
Figure 2. Model comparisons in Step 2 Scenario 1
(different relative risk and same minor allele frequency, baseline penetrance=0.1, n=200).
Figure 3
Figure 3. Model comparisons in Step 2 Scenario 2
(same relative risk and different minor allele frequency, baseline penetrance=0.1, n=200).
Figure 4
Figure 4. Model comparisons in Step 2 Scenario 2
(same relative risk and different minor allele frequency, baseline penetrance=0.1, n=500).
Figure 5
Figure 5. Model comparisons in Step 2 Scenario 3
(different relative risk and different minor allele frequency, baseline penetrance=0.1, n=200).
Figure 6
Figure 6. Model comparisons in Step 2 Scenario 3
(different relative risk and different minor allele frequency, baseline penetrance=0.1, n=500).

References

    1. Carayol J, Tores F, Konig IR, Hager J, Ziegler A. Evaluating diagnostic accuracy of genetic profiles in affected offspring families. Stat Med. 2010;29(22):2359–68. - PMC - PubMed
    1. Cordell HJ, Clayton DG. A unified stepwise regression procedure for evaluating the relative effects of polymorphisms within a gene using case/control or family data: application to HLA in type 1 diabetes. Am J Hum Genet. 2002;70(1):124–41. - PMC - PubMed
    1. Culverhouse R, Suarez BK, Lin J, Reich T. A perspective on epistasis: limits of models displaying no main effect. Am J Hum Genet. 2002;70(2):461–71. - PMC - PubMed
    1. De Jager PL, Chibnik LB, Cui J, Reischl J, Lehr S, Simon KC, Aubin C, Bauer D, Heubach JF, Sandbrink R, et al. Integration of genetic risk factors into a clinical algorithm for multiple sclerosis susceptibility: a weighted genetic risk score. Lancet Neurol. 2009;8(12):1111–9. - PMC - PubMed
    1. Hsu J. Multiple Comparisons: Theory and methods. Chapman & Hall; 1996.

Substances

LinkOut - more resources