. 2012 Nov;122(11):4130-44.
doi: 10.1172/JCI65179.

Chronic overexpression of PNPLA3I148M in mouse liver causes hepatic steatosis

Affiliations

Chronic overexpression of PNPLA3I148M in mouse liver causes hepatic steatosis

John Zhong Li et al. J Clin Invest. 2012 Nov.

Abstract

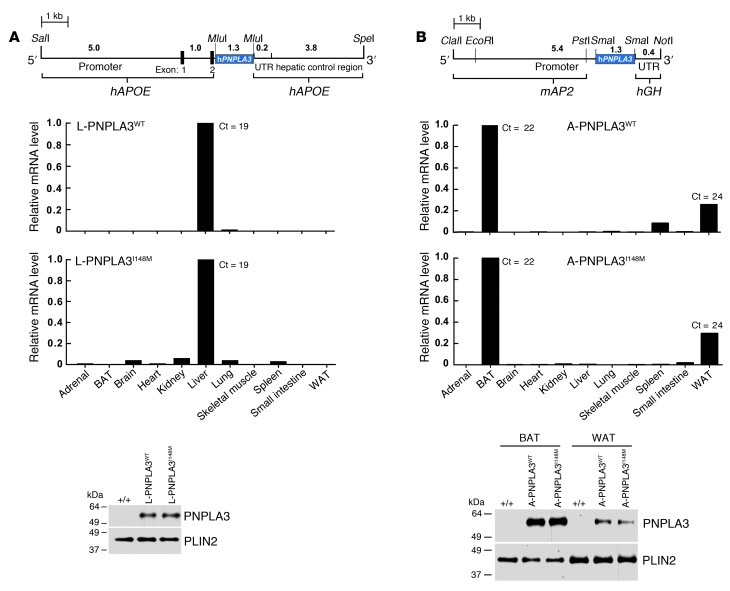
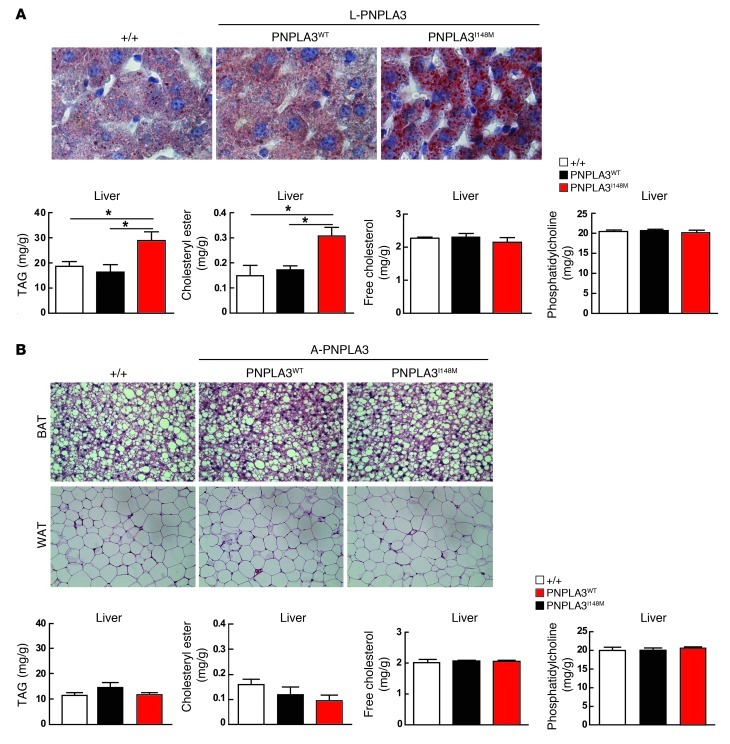
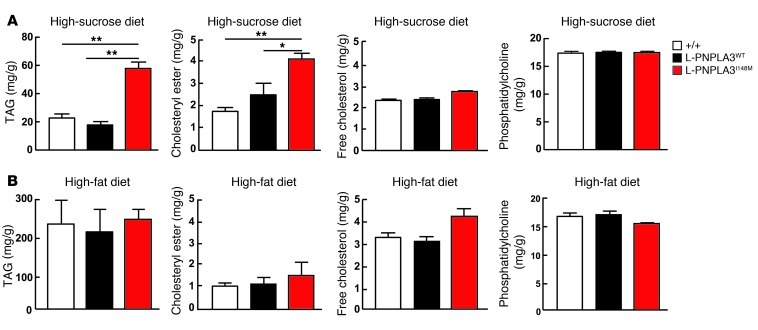
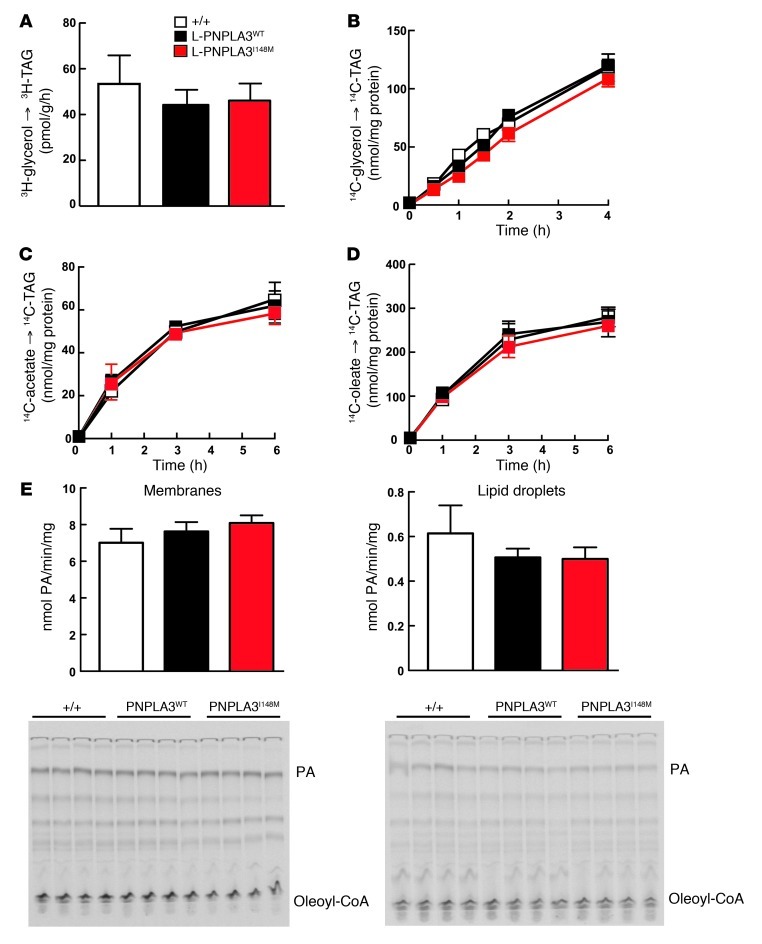
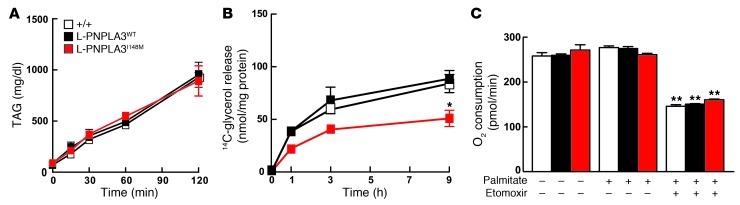
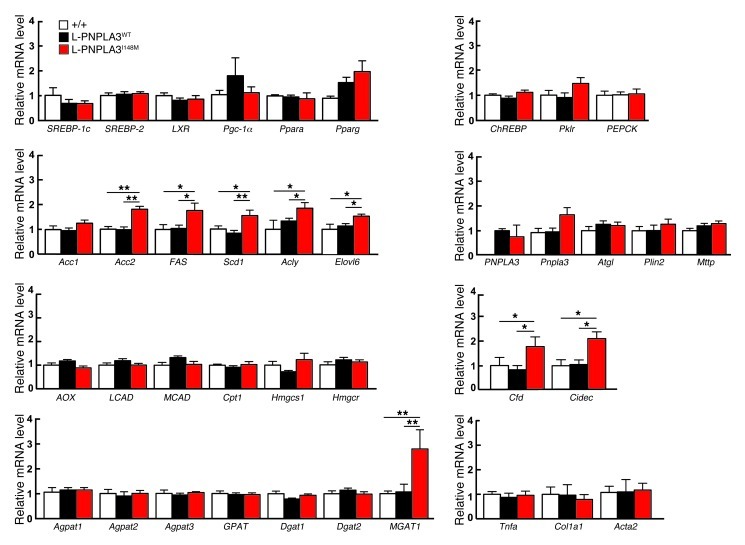
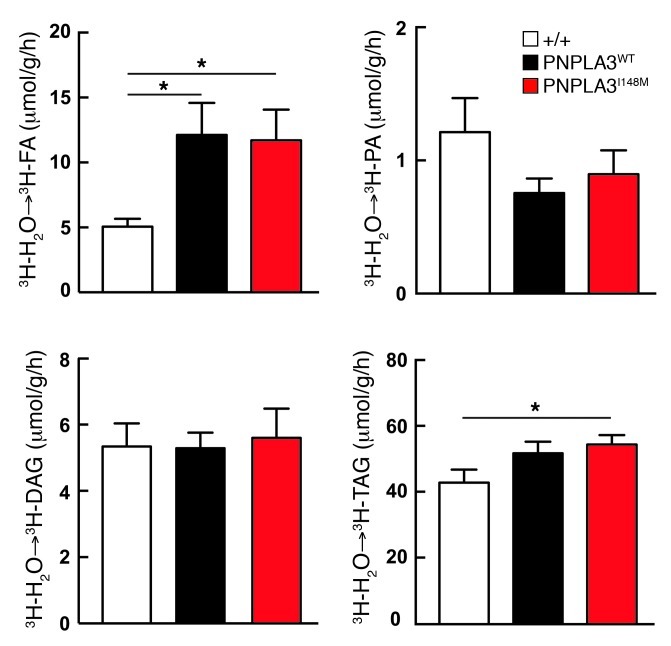
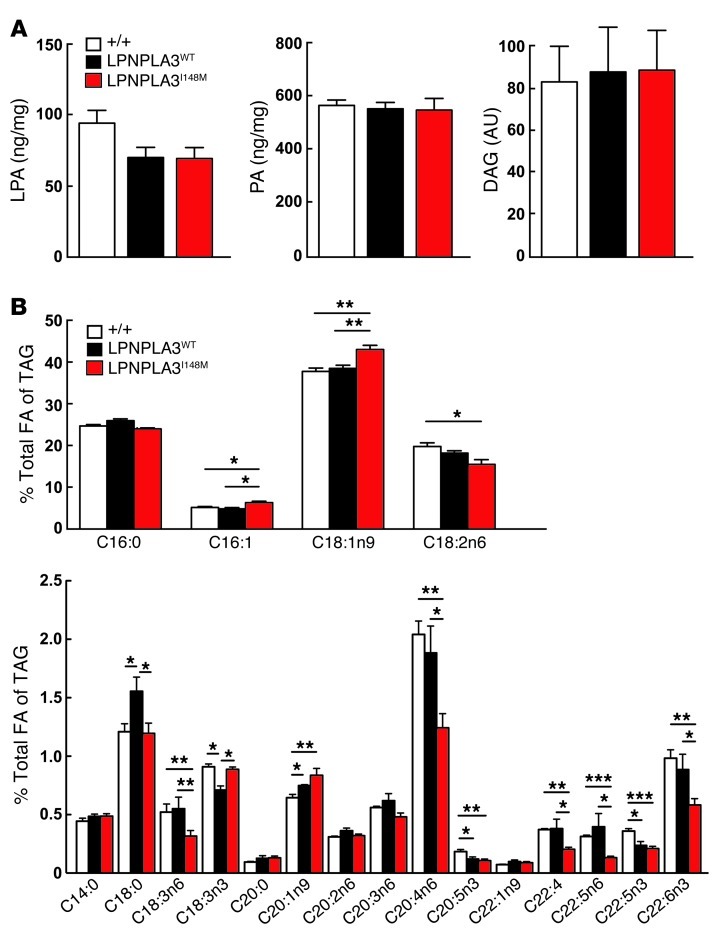
A genetic variant in PNPLA3 (PNPLA3(I148M)), a triacylglycerol (TAG) hydrolase, is a major risk factor for nonalcoholic fatty liver disease (NAFLD); however, the mechanism underlying this association is not known. To develop an animal model of PNPLA3-induced fatty liver disease, we generated transgenic mice that overexpress similar amounts of wild-type PNPLA3 (PNPLA3(WT)) or mutant PNPLA3 (PNPLA3(I148M)) either in liver or adipose tissue. Overexpression of the transgenes in adipose tissue did not affect liver fat content. Expression of PNPLA3(I148M), but not PNPLA3(WT), in liver recapitulated the fatty liver phenotype as well as other metabolic features associated with this allele in humans. Metabolic studies provided evidence for 3 distinct alterations in hepatic TAG metabolism in PNPLA3(I148M) transgenic mice: increased formation of fatty acids and TAG, impaired hydrolysis of TAG, and relative depletion of TAG long-chain polyunsaturated fatty acids. These findings suggest that PNPLA3 plays a role in remodeling TAG in lipid droplets, as they accumulate in response to food intake, and that the increase in hepatic TAG levels associated with the I148M substitution results from multiple changes in hepatic TAG metabolism. The development of an animal model that recapitulates the metabolic phenotype of the allele in humans provides a new platform in which to elucidate the role of PNLPA3(I148M) in NAFLD.


Figures

Figure 1
Figure 1. Tissue distribution of PNPLA3 mRNA in transgenic mice expressing human PNPLA3 predominantly (A) in the liver or (B) in adipose tissue.
(A) Schematic diagram of the PNPLA3 transgene, which is under control of a liver-specific enhancer/promoter element (30). Total mRNA was isolated from tissues of C57BL/6J mice expressing wild-type (L-PNPLA3WT) or mutant (L-PNPLA3I148M) human PNPLA3 (n = 4/group). Tissue levels of PNPLA3 mRNA were determined using real-time PCR, as described in the Methods. The cycle threshold (Ct) value in the liver is provided. Each value in the nonhepatic tissues represents the mRNA level relative to the value in liver. Immunoblot analysis was performed on lipid droplets isolated from the livers (22). A total of 1% of the volume of each fraction was size fractionated on an 8% SDS-PAGE gel and probed using a polyclonal anti-human PNPLA3 antibody (22). PLIN2, a lipid droplet protein, was used as a loading control. (B) Schematic diagram of the constructs used to make the A-PNPLA3WT and A-PNPLA3I148M mice (31). Tissue levels of PNPLA3 mRNA were measured by real-time PCR and expressed relative to the level in BAT. Immunoblot analysis of PNPLA3 in lipid droplets isolated from BAT and WAT was performed as described in A. UTR, untranslated region; hAPOE, human APOE; mAP2, mouse AP2; hGH, human GH.
Figure 2
Figure 2. Increased hepatic TAG content in chow-fed PNPLA3I148M transgenic mice.
(A) Liver sections from 12-week-old chow-fed wild-type (+/+) mice and PNPLA3WT and PNPLA3I148M transgenic male mice (n = 4/group) were stained with Oil Red O and viewed using a Leica microscope (DM2000) (original magnification, ×63). Hepatic lipid levels were measured in the same mice after a 4-hour fast. *P < 0.05. (B) Sections from adipose tissue of 12-week-old chow-fed wild-type mice and A-PNPLA3WT and A-PNPLA3I148M mice (n = 4/group) were stained with hematoxylin and eosin (top row). Images of BAT (original magnification, ×40) and WAT (original magnification, ×20) were taken. Hepatic lipid levels were measured after a 4-hour fast. Values are mean ± SEM (n = 4/group). Levels were compared among lines using Student’s t tests. The experiment was performed 3 times (n = 4–5 mice/group), and results were similar.
Figure 3
Figure 3. Increased hepatic TAG content in PNPLA3I148M transgenic mice fed a high-sucrose diet.
Hepatic lipid levels were measured using enzymatic assays in wild-type mice and PNPLA3WT and PNPLA3I148M transgenic male mice fed (A) a high-sucrose (58% sucrose) diet for 6 weeks or (B) a high-fat (45% fat) diet for 12 weeks. Mice were killed and livers were collected after a 4-hour fast. Liver lipids were extracted and quantitated using enzymatic assays, as described in Methods. Values are mean ± SEM (n = 5/group). Levels were compared among lines of mice using Student’s t test. *P < 0.05,**P < 0.001. The experiment was performed twice (n = 5/group), and results were similar.
Figure 4
Figure 4. Hepatic lipid synthesis in vivo or in primary hepatocytes from nontransgenic and PNPLA3I148M transgenic mice.
(A) Incorporation of 3H-glycerol into TAG. Tissue was collected from 8-week-old male mice (n = 4/group) 30 minutes after intraperitoneal injection with 3H-glycerol (1.6 nmol/mouse). (BD) Incorporation of metabolic precursors into TAG in primary hepatocytes. Primary hepatocytes from mice of the indicated genotypes were isolated, attached to collagen-coated 6-well plates for 2 hours in triplicate, and then incubated with (B) 1.5 mM 14C-glycerol, (C) 1.0 mM 14C-acetate, or (D) 0.6 mM 14C-oleic acid for the indicated times. Lipids were extracted from the cells, and TAG was isolated by TLC as described in the Methods. (E) Measurement of LPAAT activity in membranes and lipid droplets isolated from mice of the indicated genotypes (n = 4/group), as described in the Methods. For the lipid droplet fraction, a total of 2 mg protein was added to 200 ml of buffer (50 mM TrisCl, pH 7.4) plus 200 mM LPA and 5.5 mM 14C-oleoyl-CoA. For the membrane fraction, an additional 50 mM oleoyl-CoA was added to the assay. The experiments were all repeated at least twice, and the results were similar.
Figure 5
Figure 5. The rate of VLDL-TAG secretion in vivo and TAG hydrolysis and fatty acid oxidation in primary hepatocytes.
(A) Chow-fed male mice (10–12 weeks old) of the indicated genotypes (n = 5/group) were fasted for 6 hours and injected with Triton WR-1339 (500 mg/kg) to inhibit lipolysis. Blood samples were obtained from the retro-orbital plexus at the times indicated, and plasma TAG levels were measured. Values are mean ± SEM. (B) Glycerol release in primary hepatocytes from nontransgenic and transgenic mice. Primary hepatocytes were isolated and plated as described in the legend to Figure 4. Cells were incubated with 1.5 mM 14C-glycerol for 4 hours, washed with ice-cold PBS, and then treated with Triacsin C (5 μM). At the indicated times, medium was removed, and lipids were extracted using the Folch method (58). Radioactivity of 14C-glycerol released from cells into the aqueous phase was quantified. (C) Cellular O2 consumption was measured in primary hepatocytes using the Seahorse XF-24 analyzer. Cells treated with etomoxir (300 mM), an inhibitor of carnitine palmitoyltransferase 1, served as a positive control. Values represent mean ± SEM of triplicate samples. *P < 0.05, **P < 0.01.
Figure 6
Figure 6. Relative mRNA levels in livers of wild-type and PNPLA3 transgenic mice (n = 4/group).
The mice used in this experiment are described in the legend to Figure 2. Total RNA was subjected to real-time PCR quantification, and mRNA levels were expressed relative to levels in nontransgenic mice. Values are mean ± SEM. *P < 0.05, **P < 0.01. The experiment was repeated, and the results were similar. Pgc-1α, PPARγ co-activator 1α; ChREBP, carbohydrate-responsive element–binding protein; Pklr, liver pyruvate kinase; PEPCK, phosphoenoylpyruvate carboxykinase; Acc1, acetyl-CoA carboxylase-1; Acc2, acetyl-CoA carboxylase β; FAS, fatty acid synthase; Scd1, stearoyl-CoA desaturase-1; Acly, ATP citrate lyase; Elovl6, ELOVL family member 6; AOX, acyl-CoA oxidase-1; LCAD, long-chain acyl-CoA dehydrogenase; MCAD, medium-chain acyl-CoA dehydrogenase; Cpt1, carnitine palmitoyltransferase 1; Hmgcs1, HMG-CoA synthase; Hmgcr, HMG-CoA reductase; Agpat1, 1-acylglycerol-3-phosphate O-acyltransferase 1; Agpat2, 1-acylglycerol-3-phosphate O-acyltransferase 2; Agpat3, 1-acylglycerol-3-phosphate O-acyltransferase 3; GPAT, glycerol-3-phosphate acyltransferase; Dgat1, diglyceride acyltransferase-1; Dgat2, diglyceride acyltransferase-2; Atgl, adipose triglyceride lipase; Mttp, microsomal TAG transfer protein; Col1a1, collagen, type 1α1; Acta2, α-smooth muscle actin.
Figure 7
Figure 7. The incorporation of 3H-H2O into fatty acids, PAs, DAGs, and TAGs in livers of 10- to 12-week-old male mice (n = 10/group) fed a high-sucrose diet for 1 week, as described in Methods.
Each bar represents mean ± SEM values. FA, fatty acid. *P < 0.01.
Figure 8
Figure 8. Selected lipid levels and fatty acid composition of TAGs in livers of wild-type and PNPLA3 transgenic mice.
(A) Levels of LPA, PA, and DAG were measured in the livers of 12- to 13-week-old male wild-type mice and PNPLA3WT and PNPLA3I148M transgenic mice on ad libitum diet (n = 5/group). (B) Fatty acid profiles of TAGs in livers of 12- to 13-week-old male mice of the indicated genotypes (n = 5/group). Lipids were extracted from the liver, as described in the Methods, and the TAG fraction was separated by TLC. TAGs were hydrolyzed, and the fatty acids were methyl-esterified and quantified by gas chromatography. Each value represents the mean ± SEM. *P < 0.05, **P < 0.01, ***P < 0.001.

References

    1. Ludwig J, Viggiano TR, McGill DB, Oh BJ. Nonalcoholic steatohepatitis: Mayo Clinic experiences with a hitherto unnamed disease. Mayo Clin Proc. 1980;55(7):434–438. - PubMed
    1. Day CP, James OF. Steatohepatitis: a tale of two “hits”? Gastroenterology. 1998;114(4):842–845. doi: 10.1016/S0016-5085(98)70599-2. - DOI - PubMed
    1. Browning JD, et al. Prevalence of hepatic steatosis in an urban population in the United States: impact of ethnicity. Hepatology. 2004;40(6):1387–1395. doi: 10.1002/hep.20466. - DOI - PubMed
    1. Cohen JC, Horton JD, Hobbs HH. Human fatty liver disease: old questions and new insights. Science. 2011;332(6037):1519–1523. doi: 10.1126/science.1204265. - DOI - PMC - PubMed
    1. Speliotes EK, et al. Genome-wide association analysis identifies variants associated with nonalcoholic fatty liver disease that have distinct effects on metabolic traits. PLoS Genet. 2011;7(3):e1001324. doi: 10.1371/journal.pgen.1001324. - DOI - PMC - PubMed

Publication types

MeSH terms