. 2012 Nov;122(11):3873-87.
doi: 10.1172/JCI62818.

HEXIM1 controls satellite cell expansion after injury to regulate skeletal muscle regeneration

Affiliations

HEXIM1 controls satellite cell expansion after injury to regulate skeletal muscle regeneration

Peng Hong et al. J Clin Invest. 2012 Nov.

Abstract

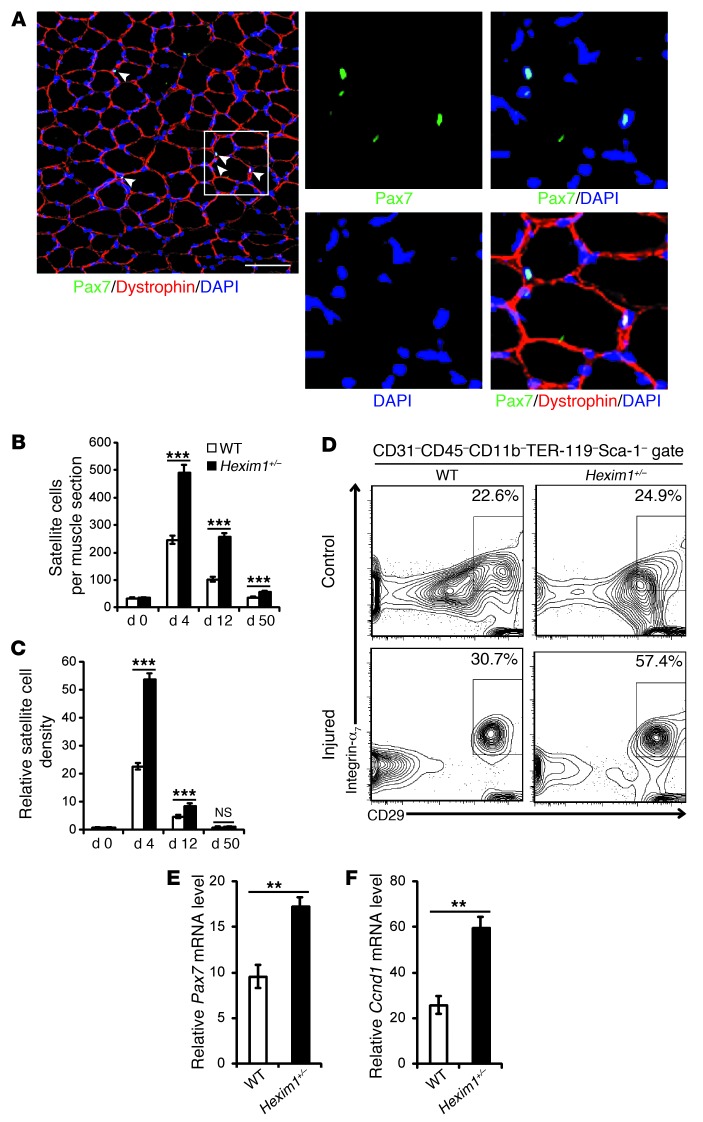
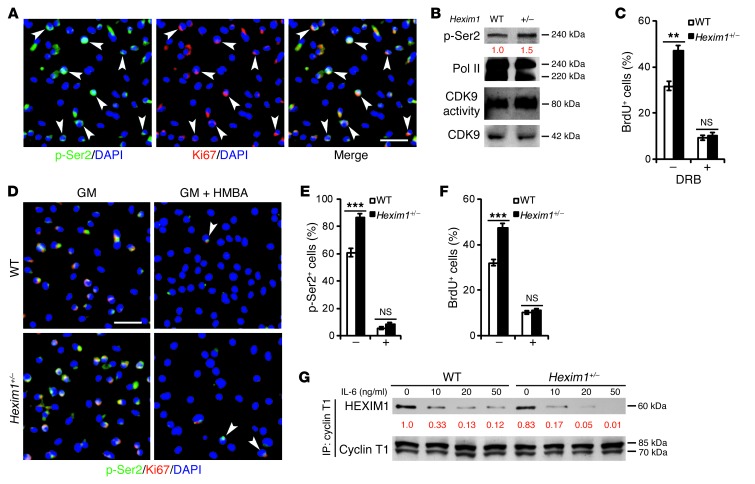
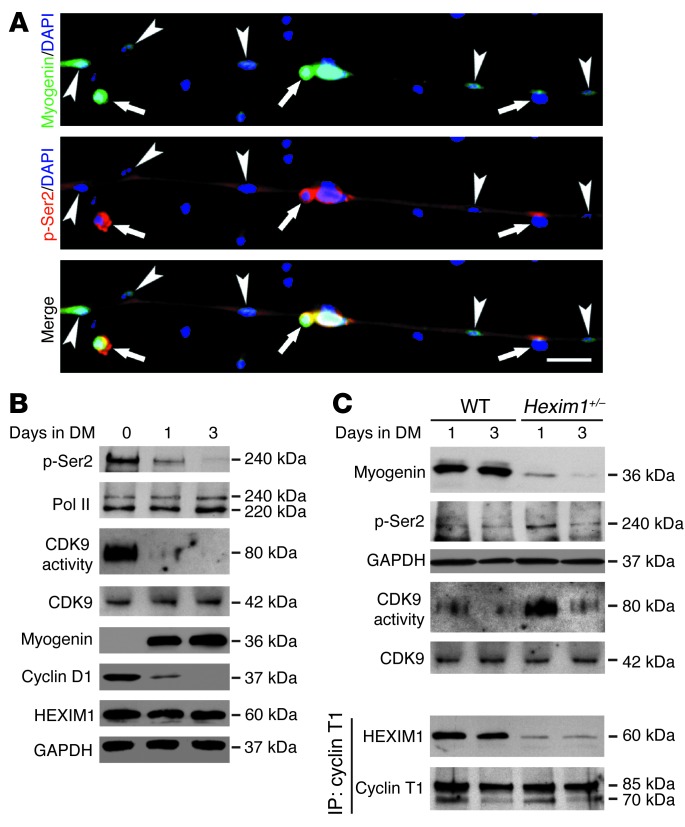
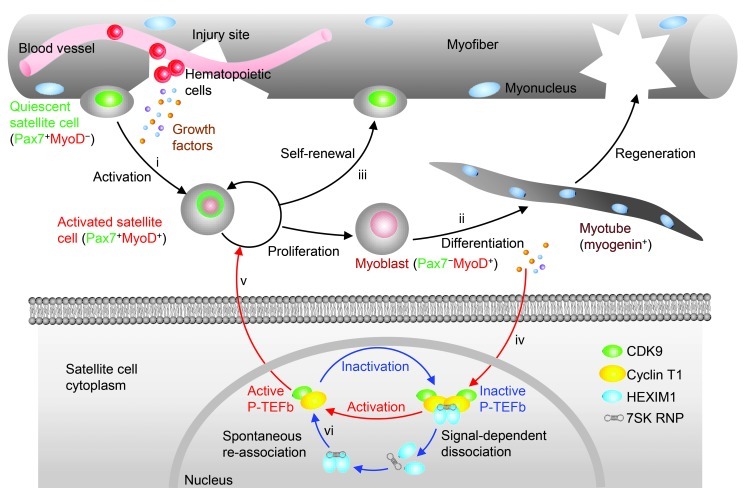
The native capacity of adult skeletal muscles to regenerate is vital to the recovery from physical injuries and dystrophic diseases. Currently, the development of therapeutic interventions has been hindered by the complex regulatory network underlying the process of muscle regeneration. Using a mouse model of skeletal muscle regeneration after injury, we identified hexamethylene bisacetamide inducible 1 (HEXIM1, also referred to as CLP-1), the inhibitory component of the positive transcription elongation factor b (P-TEFb) complex, as a pivotal regulator of skeletal muscle regeneration. Hexim1-haplodeficient muscles exhibited greater mass and preserved function compared with those of WT muscles after injury, as a result of enhanced expansion of satellite cells. Transplanted Hexim1-haplodeficient satellite cells expanded and improved muscle regeneration more effectively than WT satellite cells. Conversely, HEXIM1 overexpression restrained satellite cell proliferation and impeded muscle regeneration. Mechanistically, dissociation of HEXIM1 from P-TEFb and subsequent activation of P-TEFb are required for satellite cell proliferation and the prevention of early myogenic differentiation. These findings suggest a crucial role for the HEXIM1/P-TEFb pathway in the regulation of satellite cell–mediated muscle regeneration and identify HEXIM1 as a potential therapeutic target for degenerative muscular diseases.


Figures

Figure 1
Figure 1. Hexim1+/– muscles exhibit larger size and enhanced function after regeneration.
(A) Model of BaCl2-induced muscle injury. Dystrophin staining outlines muscle sarcomeres. Scale bar: 80 μm. (B) Injured and contralateral control TA muscles 50 days after injury. (C) Muscle wet weights, (D) cross-section areas, and (C and D) their injured-to-control ratios 50 days after injury (n = 12). (E) Representative plots of tetanic force production of injured and contralateral control TA muscles. (F) Absolute tetanic forces, (G) normalized tetanic forces, and (F and G) their injured-to-control ratios 10 weeks after injury (n = 3 [WT] or 6 [Hexim1+/–]). (H) Muscle sections 50 days after injury stained for dystrophin (red). Scale bar: 80 μm. (I) Average numbers of muscle fibers per section, (J) average individual myofiber sizes, and (K) average numbers of myonuclei per 100 muscle fibers 50 days after injury (n = 6). (L) Col1a2 mRNA levels 4 days after injury (n = 3). Statistical significance in scatter plots was assessed by a 2-tailed paired Student’s t test. *P < 0.05; **P < 0.01; ***P < 0.001.
Figure 2
Figure 2. Hexim1+/– muscles harbor more satellite cells during regeneration.
(A) Sample section stained for Pax7 (green) and dystrophin (red). Arrowheads indicate myofiber-associated Pax7+ satellite cells. Colocalization of Pax7 and DAPI staining in the nuclei of satellite cells from the boxed region is shown to the right. Scale bar: 80 μm. (B) Average numbers of Pax7+ satellite cells per section and (C) relative satellite cell densities defined as the ratio of satellite cell number to the cross-section area and normalized to the ratio in WT muscles before injury. Results were calculated from the average values of 3 muscle sections per mouse, and 6 mice were analyzed. (D) Satellite cell percentages in injured and contralateral control muscles 4 days after injury. Plots were representative of 6 independent experiments. (E) Pax7 mRNA levels 4 days after injury (n = 3). (F) Ccnd1 mRNA levels 4 days after injury (n = 3). **P < 0.05; ***P < 0.001.
Figure 3
Figure 3. Hexim1+/– satellite cells exhibit enhanced proliferation during regeneration.
(A and B) Representative plots and statistics showing cell cycle status of (A) sorted satellite cells and (B) Sca-1+ cells from injured and contralateral control muscles 4 days after injury. G0, G1, and S/G2/M cells are identified as being Hoechst blueloPyronin Ylo, Hoechst blueloPyronin Yhi, and Hoechst bluehiPyronin Yhi, respectively (n = 3). (C and D) Representative plots showing apoptosis of (C) sorted satellite cells and (D) Sca-1+ cells from injured and contralateral control muscles 4 days after injury. (E and F) Percentages of (E) satellite cells and (F) Sca-1+ cells in injured and contralateral control muscles 4 days after injury. *P < 0.05. Plots were representative of 3 independent experiments. Numbers represent percentages of cells in each gate or quadrant.
Figure 4
Figure 4. Transplanted Hexim1+/– satellite cells undergo enhanced expansion and improve muscle regeneration.
(A) Scheme of satellite cell transplantation. (B) Purity and composition of freshly sorted cells. 466 out of 500 analyzed cells from 3 sorting experiments were Pax7+MyoD. Scale bar: 20 μm. (C) PKH26 signal of transplanted cells 3 days after transplantation. Host cells were excluded from analysis by PKH26 gating shown in Supplemental Figure 5D. (D) Percentages of phospho-histone H3+ (p-H3+) cells among PKH26+ cells 3 days after transplantation (n = 6). (E) PKH26+ cells per 1,000 viable cells 3 days after transplantation (n = 6). (F) Percentages of satellite cells in recipient muscles 3 days after transplantation. (G) Transplanted and contralateral TA muscles 50 days after transplantation. (H) Weights of transplanted TA muscles normalized to those of contralateral muscles 50 days after injury (n = 6). (I) Muscle sections 50 days after transplantation stained for dystrophin (red). Scale bar: 80 μm. *P < 0.05; **P < 0.01; ***P < 0.001. Histograms and plots were representative of 6 independent transplantation experiments.
Figure 5
Figure 5. Hexim1+/– satellite cells exhibit enhanced proliferation over differentiation.
(A) Average numbers of cells per colony from 20 single cell–derived colonies. Data points represent days 1, 2, 3, and 4 of culture in GM (n = 6). (B) Histogram showing PKH26 signals of sorted cells cultured in GM for 1 or 4 days. (C) Single cell–derived colonies stained for Pax7 (green) and MyoD (red). Arrows indicate Pax7+MyoD cells. Scale bar: 20 μm. (D) Percentages of cells in satellite cells cultured for 3 days in GM. (E) Muscle sections 4 days after injury stained for laminin (green) and myogenin (red). Laminin outlines regenerating myofibers, and myogenin marks differentiating myogenic cells. Scale bar: 100 μm. (F) Immunoblots of desmin and MHC in injured and contralateral control muscles 4 days after injury. (G) Myh3 mRNA levels 4 days after injury (n = 3). (H) Percentages of transplanted cells retaining satellite cell markers 3 days after transplantation. (I) Percentages of myogenin+ cells among PKH26+ cells 3 days after transplantation (n = 3). *P < 0.05; **P < 0.01; ***P < 0.001. Plots were representative of 6 independent experiments.
Figure 6
Figure 6. HMBA-induced HEXIM1 expression restrains satellite cell proliferation and promotes differentiation.
(A) Immunoblots of satellite cells cultured in GM for the indicated period of time with or without 10 mM HMBA. (B) BrdU incorporation of satellite cells cultured in GM with HMBA for the indicated time periods. 200 nuclei per slide were counted (n = 6 slides). (C) Satellite cells cultured in GM for 3 days stained for myogenin (green) and Pax7 (red) and (D) percentages of differentiating cells (myogenin+) (n = 6). (C and D) Green arrowheads indicate differentiating cells. Scale bar: 40 μm. (E) Immunoblots of satellite cells cultured in DM. (F) Apoptosis of satellite cells cultured in DM for 1 day. *P < 0.05; **P < 0.01; ***P < 0.001. Plots were representative of 3 independent experiments.
Figure 7
Figure 7. HEXIM1 overexpression reduces regenerative capacity by promoting early differentiation of satellite cells.
(A and B) Wet weights and cross-section areas of injured TA muscles normalized to those of contralateral controls 50 days after injury. HMBA was administered at indicated time points, as illustrated in Supplemental Figure 7 (n = 3). (C and D) Sections of Hexim1+/– TA muscles 4 days after injury stained for (C) laminin (green) and myogenin (red) or (D) laminin (green) and MHC (red). Scale bar: 100 μm. *P < 0.05.
Figure 8
Figure 8. P-TEFb activation after HEXIM1 dissociation is required for satellite cell proliferation.
(A) WT satellite cells cultured in GM for 3 days and stained for p-Ser2 (green) and Ki67 (red). Arrowheads indicate colocalization of Ki67 and p-Ser2 signals. Scale bar: 40 μm. (B) Immunoblots of satellite cells cultured in GM for 3 days. Red numbers indicate band intensity relative to that of WT. Pol II and CDK9 served as the control for p-Ser2 and CDK9 kinase activity, respectively. (C) BrdU incorporation in satellite cells cultured in GM with 50 μM DRB for 24 hours (n = 6). (DF) Satellite cells cultured in GM with HMBA for 3 days (D) stained for p-Ser2 (green) and Ki67 (red) and (E) quantitated for percentages of p-Ser2+ cells and (F) BrdU incorporation rates. Arrowheads point to cells in cell cycle after HMBA treatment (n = 6). Scale bar: 40 μm. (G) Immunoblots of satellite cells cultured in GM with indicated concentrations of IL-6 for 6 hours and immunoprecipitated with cyclin T1 antibody. Cyclin T1 served as control for immunoprecipitation. Red numbers below lanes indicate band intensity relative to that of untreated WT cells. **P < 0.01; ***P < 0.001.
Figure 9
Figure 9. Insufficient inhibition of P-TEFb by HEXIM1 enhances satellite cell proliferation by suppressing myogenic differentiation.
(A) WT satellite cells cultured in DM for 3 days stained for myogenin (green) and p-Ser2 (red). Red background outlines the myotube. Arrows indicate myonuclei undergoing fusion into the myotube. Arrowheads point to differentiated myonuclei located inside the myotube. Scale bar: 40 μm. (B) Immunoblots of WT satellite cells cultured in DM for 0, 1, or 3 days. Pol II and CDK9 served as the control for p-Ser2 and CDK9 kinase activity, respectively. Immunoblots of (C) whole lysate and (D) lysates immunoprecipitated with cyclin T1 antibody from satellite cells cultured in DM for 1 or 3 days. Cyclin T1 served as the control for immunoprecipitation.
Figure 10
Figure 10. Model of HEXIM1/P-TEFb–dependent regulation of skeletal muscle regeneration.
(i) Satellite cells are activated to proliferate by factors secreted in response to muscle injury, (ii) followed by myogenic differentiation and formation of new myofibers or (iii) return to quiescence to renew the satellite cell niche. P-TEFb, (iv) which is activated during regeneration, (v) promotes proliferation of satellite cells. (vi) HEXIM1 inhibits P-TEFb function by associating with the active P-TEFb complex and hence limits satellite cell proliferation and skeletal muscle regeneration.

References

    1. Charge SB, Rudnicki MA. Cellular and molecular regulation of muscle regeneration. Physiol Rev. 2004;84(1):209–238. doi: 10.1152/physrev.00019.2003. - DOI - PubMed
    1. Tedesco FS, Dellavalle A, Diaz-Manera J, Messina G, Cossu G. Repairing skeletal muscle: regenerative potential of skeletal muscle stem cells. J Clin Invest. 2010;120(1):11–19. doi: 10.1172/JCI40373. - DOI - PMC - PubMed
    1. McNally EM, Pytel P. Muscle diseases: the muscular dystrophies. Annu Rev Pathol. 2007;2:87–109. doi: 10.1146/annurev.pathol.2.010506.091936. - DOI - PubMed
    1. Jarvinen TA, Jarvinen TL, Kaariainen M, Kalimo H, Jarvinen M. Muscle injuries: biology and treatment. Am J Sports Med. 2005;33(5):745–764. doi: 10.1177/0363546505274714. - DOI - PubMed
    1. Lu QL, et al. Functional amounts of dystrophin produced by skipping the mutated exon in the mdx dystrophic mouse. Nat Med. 2003;9(8):1009–1014. doi: 10.1038/nm897. - DOI - PubMed

Publication types

MeSH terms