. 2012 Dec;53(12):2755-66.
doi: 10.1194/jlr.P030338. Epub 2012 Sep 28.

Increase in short-chain ceramides correlates with an altered lipid organization and decreased barrier function in atopic eczema patients

Affiliations

Increase in short-chain ceramides correlates with an altered lipid organization and decreased barrier function in atopic eczema patients

Michelle Janssens et al. J Lipid Res. 2012 Dec.

Abstract

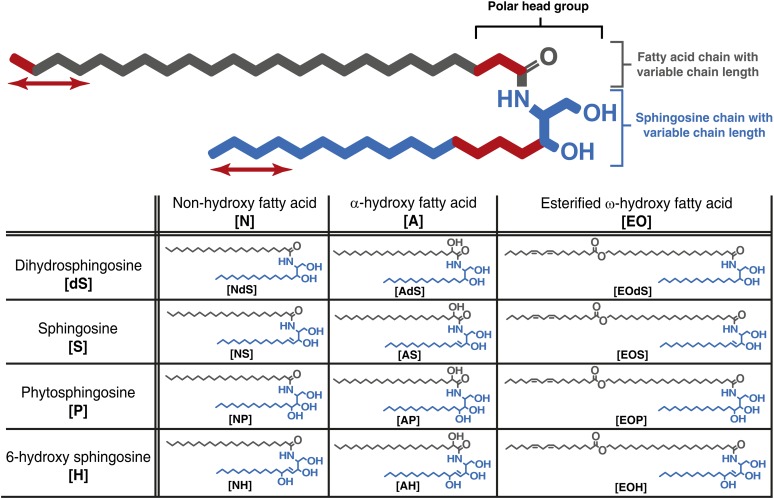
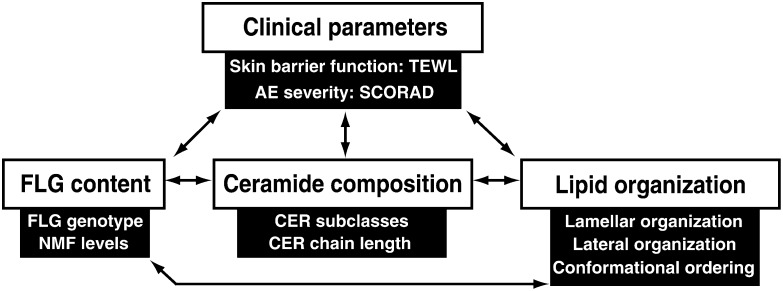
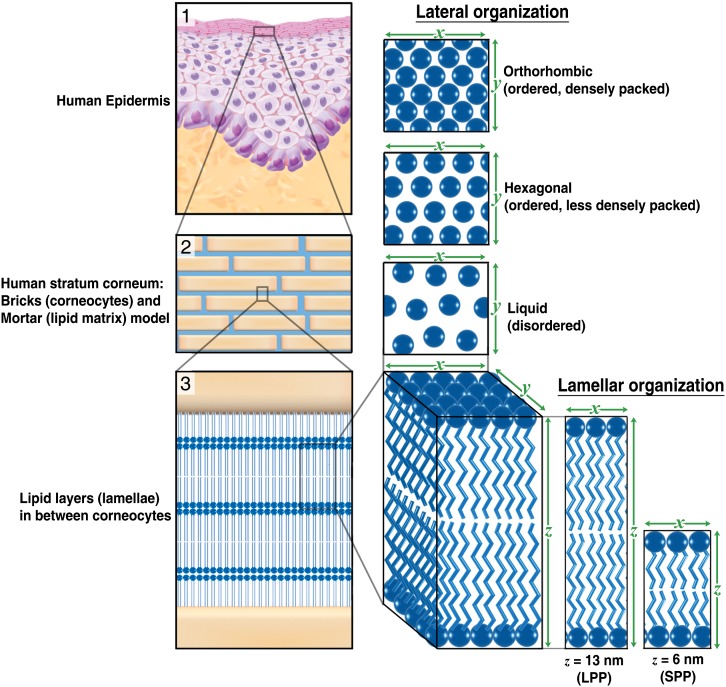
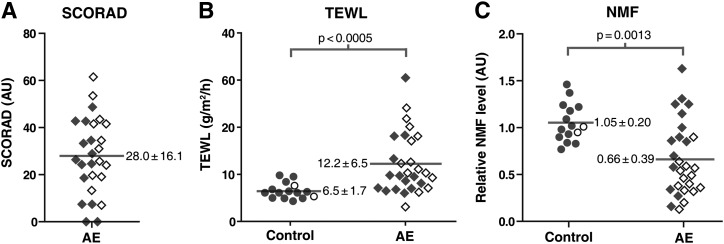
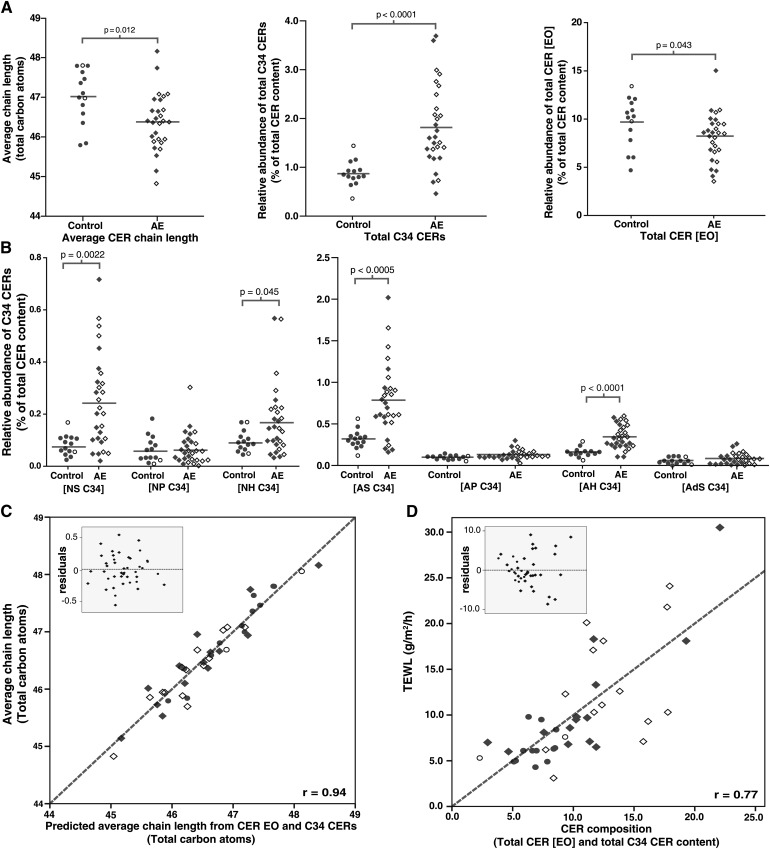
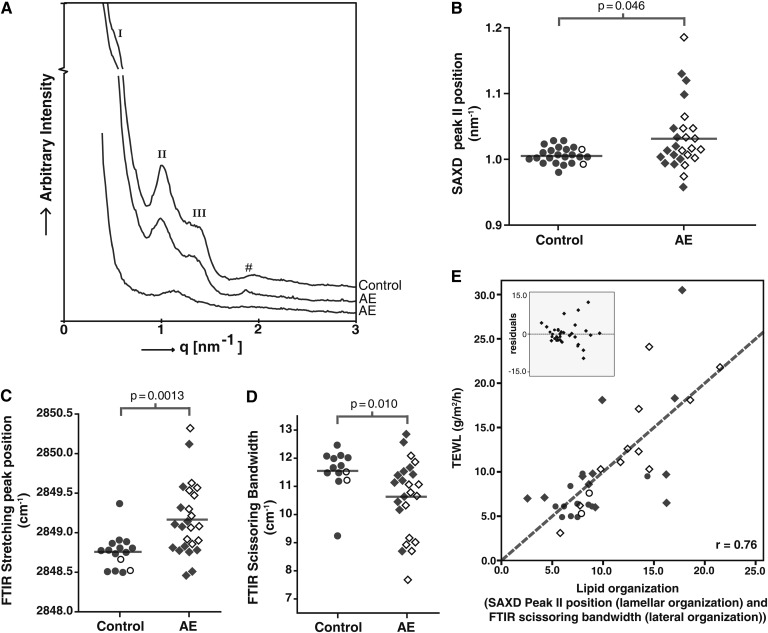
A hallmark of atopic eczema (AE) is skin barrier dysfunction. Lipids in the stratum corneum (SC), primarily ceramides, fatty acids, and cholesterol, are crucial for the barrier function, but their role in relation to AE is indistinct. Filaggrin is an epithelial barrier protein with a central role in the pathogenesis of AE. Nevertheless, the precise causes of AE-associated barrier dysfunction are largely unknown. In this study, a comprehensive analysis of ceramide composition and lipid organization in nonlesional SC of AE patients and control subjects was performed by means of mass spectrometry, infrared spectroscopy, and X-ray diffraction. In addition, the skin barrier and clinical state of the disease were examined. The level of ceramides with an extreme short chain length is drastically increased in SC of AE patients, which leads to an aberrant lipid organization and a decreased skin barrier function. Changes in SC lipid properties correlate with disease severity but are independent of filaggrin mutations. We demonstrate for the first time that changes in ceramide chain length and lipid organization are directly correlated with the skin barrier defects in nonlesional skin of AE patients. We envisage that these insights will provide a new therapeutic entry in therapy and prevention of AE.


Figures

Fig. 1.
Fig. 1.
Structure and nomenclature of CERs. All CERs bear a polar head group and two long carbon chains. The polar head group may vary in molecular architecture (at the carbon positions marked in red), resulting in 12 different subclasses in human SC. Both chains in every CER subclass show varying carbon chain lengths (marked by red arrows). Each CER subclass is denoted by its sphingoid base (blue) and fatty acid chain (gray), resulting in the 12 CER subclasses. Sphingoid base abbreviations: dS, dihydrosphingosine; H, 6-hydroxy sphingosine; P, phytosphingosine; S, sphingosine. Acyl chain abbreviations: A, α-hydroxy fatty acid; EO, esterified ω-hydroxy fatty acid; N, nonhydroxy fatty acid. These abbreviations result in the 12 CER subclasses notations: [NdS], [AdS], [EOdS], [NS], [AS], [EOS], [NP], [AP], [EOP], [NH], [AH], [EOH]. The number of total carbon atoms in the CERs (e.g., C34 CERs) is the number of carbon atoms in the fatty acid chain plus the number of carbon atoms in the sphingoid base.
Fig. 2.
Fig. 2.
Schematic overview of the SC lipid parameters, clinical parameters, and the determinants of the filaggrin content discussed in this article. These parameters may all affect the skin barrier and are therefore investigated in this study. Arrows indicate possible correlations that are discussed.
Fig. 3.
Fig. 3.
Lamellar and lateral organization in human stratum corneum. (1) The outermost layer of the epidermis, the SC, consists of dead cells (corneocytes) embedded in a lipid matrix, also referred to as the brick (corneocytes) and mortar (lipids) structure (2). The intercellular lipids are arranged in layers (lamellae) (3), with two coexisting lamellar phases. These lamellar phases have a repeat distance of 6 nm (referred to as the SPP) or 13 nm (referred to as the LPP). The lateral organization is the plane perpendicular to the direction of the lamellar organization. There are three possible arrangements of the lipids: a very dense, ordered orthorhombic organization; a less dense, ordered hexagonal organization; and a disordered liquid organization.
Fig. 4.
Fig. 4.
SCORAD, TEWL, and NMF levels in control subjects and AE patients. Dot plots showing individual control subjects (open and filled circles) and AE patients (open and filled diamonds) of the measured parameters (A) SCORAD, (B) TEWL, and (C) NMF levels. Open and filled data points indicate carriers and noncarriers of FLG mutations, respectively. Means are indicated by gray horizontal lines and their corresponding values (± SD). Significant differences were observed between control subjects and AE patients for both TEWL and NMF. FLG mutations were associated with reduced NMF levels in AE patients (P < 0.005) but not with SCORAD and TEWL.
Fig. 5.
Fig. 5.
CER composition in control subjects and AE patients. (A) Dot plot showing the average chain length of all CERs in total; the relative abundance of total C34 CERs, and the relative abundance of total [EO] CERs. (B) Dot plots indicating the relative abundance of C34 CER species for each subclass. (C) Scatter plot of univariate analysis of the predicted average chain length (by the abundance of C34 CERs and [EO] CERs) versus the observed average chain length. Gray dotted line represents the optimal fit (r = 0.94): Average chain length = (0.33 × C34 CERs) + (0.24 × CER[EO]). (D) Scatter plot of univariate analysis of C34 CER and CER [EO] versus the TEWL. Insets show the residuals of the respective plots. Gray dotted line represents the optimal fit (r = 0.77): TEWL = 8.2 + (4.6 × C34 CERs) − (0.6 × CER[EO]). Control subjects are indicated by open and filled circles. AE patients with are indicated by open and filled diamonds. Data points indicate carriers and noncarriers of FLG mutations, respectively.
Fig. 6.
Fig. 6.
Lipid organization in control subjects and AE patients. (A) The upper SAXD curve of a control subject shows the first (I), second (II), and third (III) order peak positions of the LPP. #Phase-separated cholesterol. The middle diffraction curve is from an AE patient and resembles the pattern of SC of the control subject. The bottom curve of an AE patient shows only the presence of peak II. (B) Position of peak II in SAXD curves. (C) Position of the stretching vibrations in the FTIR spectrum. (D) Scissoring bandwidth in the FTIR spectrum. (E) Correlation between lipid organization and TEWL. Scatter plot of univariate analysis of SAXD peak II position + bandwidth of scissoring vibrations versus the TEWL. The inset shows the residuals of this plot. The gray dotted line represents the optimal fit (r = 0.76): TEWL = −30.1 + (64 × SAXD peakII position) − (2.3 × Bandwidth). The correlation coefficient is 0.76. Control subjects are indicated by open and filled circles AE patients with are indicated by open and filled diamonds. Data points indicate carriers and noncarriers of FLG mutations, respectively.

References

    1. Proksch E., Folster-Holst R., Jensen J. M. 2006. Skin barrier function, epidermal proliferation and differentiation in eczema. J. Dermatol. Sci. 43: 159–169 - PubMed
    1. Elias P. M., Menon G. K. 1991. Structural and lipid biochemical correlates of the epidermal permeability barrier. Adv. Lipid Res. 24: 1–26 - PubMed
    1. Masukawa Y., Narita H., Sato H., Naoe A., Kondo N., Sugai Y., Oba T., Homma R., Ishikawa J., Takagi Y., et al. 2009. Comprehensive quantification of ceramide species in human stratum corneum. J. Lipid Res. 50: 1708–1719 - PMC - PubMed
    1. van Smeden J., Hoppel L., van der Heijden R., Hankemeier T., Vreeken R. J., Bouwstra J. A. 2011. LC/MS analysis of stratum corneum lipids: ceramide profiling and discovery. J. Lipid Res. 52: 1211–1221 - PMC - PubMed
    1. Cork M. J., Robinson D. A., Vasilopoulos Y., Ferguson A., Moustafa M., MacGowan A., Duff G. W., Ward S. J., Tazi-Ahnini R. 2006. New perspectives on epidermal barrier dysfunction in atopic dermatitis: gene-environment interactions. J. Allergy Clin. Immunol. 118: 3–21; quiz 22–23 - PubMed

Publication types

LinkOut - more resources