. 2012;7(9):e44987.
doi: 10.1371/journal.pone.0044987. Epub 2012 Sep 14.

Sepsis-induced acute lung injury (ALI) is milder in diabetic rats and correlates with impaired NFkB activation

Affiliations

Sepsis-induced acute lung injury (ALI) is milder in diabetic rats and correlates with impaired NFkB activation

Luciano R Filgueiras Jr et al. PLoS One. 2012.

Abstract

Acute lung injury (ALI) develops in response to a direct insult to the lung or secondarily to a systemic inflammatory response, such as sepsis. There is clinical evidence that the incidence and severity of ALI induced by direct insult are lower in diabetics. In the present study we investigated whether the same occurs in ALI secondarily to sepsis and the molecular mechanisms involved. Diabetes was induced in male Wistar rats by alloxan and sepsis by caecal ligation and puncture surgery (CLP). Six hours later, the lungs were examined for oedema and cell infiltration in bronchoalveolar lavage. Alveolar macrophages (AMs) were cultured in vitro for analysis of IκB and p65 subunit of NFκB phosphorylation and MyD88 and SOCS-1 mRNA. Diabetic rats were more susceptible to sepsis than non-diabetics. In non-diabetic rats, the lung presented oedema, leukocyte infiltration and increased COX2 expression. In diabetic rats these inflammatory events were significantly less intense. To understand why diabetic rats despite being more susceptible to sepsis develop milder ALI, we examined the NFκB activation in AMs of animals with sepsis. Whereas in non-diabetic rats the phosphorylation of IκB and p65 subunit occurred after 6 h of sepsis induction, this did not occur in diabetics. Moreover, in AMs from diabetic rats the expression of MyD88 mRNA was lower and that of SOCS-1 mRNA was increased compared with AMs from non-diabetic rats. These results show that ALI secondary to sepsis is milder in diabetic rats and this correlates with impaired activation of NFκB, increased SOCS-1 and decreased MyD88 mRNA.


Conflict of interest statement

Competing Interests: The authors have declared that no competing interests exist.

Figures

Figure 1
Figure 1. Survival rate.
Percentage of diabetic and non-diabetic rats submitted to CLP-induced sepsis that died in a given time. Diabetes was induced by i.v. injection of alloxan (42 mg/kg/iv) in Wistar rats and 10 days later CLP was performed (12 punctures with a 20 G needle). n = 5/group, repeated three times with identical results. Data are presented as mean ± SEM. **P<0.01 diabetic vs. non-diabetic.
Figure 2
Figure 2. Lung oedema at 6 h after CLP.
Diabetic and non-diabetic rats were submitted to CLP and after 6 h the lungs were removed and processed. (A) Photomicrographs of peribronchovascular axis in lung stained with haematoxylin-eosin; ‘B’ stands for bronchiole and ‘V’ for venule. Note the presence of oedema around the venule (leakage area marked in black bars). Photographs were taken at an original magnification of 200x. (B) Quantification of perivascular oedema by light microscopy with an integrating eyepiece with a coherent system consisting of a grid with 100 points and 50 lines (known length).The number of points falling on areas of perivascular oedema and the number of intercepts between the lines of the integrating eyepiece and the basal membrane of the vessels were counted. The oedema index was calculated as follows: number of points1/2/number of intercepts. Ten random non-coincident microscopic fields containing a bronchus and a venule were evaluated for each group, n = 5 per group. (C) Evaluation of lung oedema by total protein content in the BAL after 6 hours of CLP or sham-operated, n = 5/group and scale bar  = 50 µm. Data are presented as mean ± SEM. ***P<0.001.
Figure 3
Figure 3. Inflammatory cell infiltration in lung at 6h after CLP.
Diabetic and non-diabetic rats were submitted to CLP and after 6h the lungs were removed and processed. (A) Photomicrographs of lung parenchyma stained with haematoxylin-eosin. (B) Mononuclear and polymorphonuclear cell index was determined in the parenchyma. The cell index quantification was performed with an integrating eyepiece with a coherent system consisting of a grid with 100 points and 50 lines (known length); cells were evaluated at x1,000 magnification. Points falling on mononuclear or PMN cells were counted and divided by the total number of points falling on tissue areas in each microscopic field. Ten random non-coincident microscopic fields were evaluated for each group, n = 5/group and scale bar  = 50 µm. Data are presented as mean ± SEM. * P<0.05; ***P<0.001.
Figure 4
Figure 4. Inflammatory cell infiltration in BAL fluid and lung COX2 expression at 6h after CLP.
Diabetic and non-diabetic rats were submitted to CLP or SHAM (false surgery) and after 6h bronchoalveolar lavage (BALF) was performed. (A) mononuclear and PMN cell were counted in haematoxilin-eosin stained cytospin preparations of BALF cells after total cell count was performed under light microscopy. (B) Expression of COX2 protein in lung homogenates six hours after CLP analysed by immunoblotting using antibodies to COX-2 and quantified by densitometric analysis of the immunoblot bands. Density values of bands were normalized to the total β-actin present in each lane and expressed as a percentage of control. n = 5/group, data are presented as mean ± SEM; *, P<0.05.
Figure 5
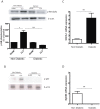
Figure 5. NFkB activation in alveolar macrophages 6h after CLP.
Alveolar macrophages (AM) were obtained by lung lavage six hours after CLP and allowed to adhere in culture plates for 1 h. Total mRNA or total protein was extracted from AMs. (A) 20 µg of total protein analysed by immunoblotting using antibodies to phosphorylated – IκBα and β-actin.The bands were quantified by densitometric analysis. Density values of bands were normalized to the total β-actin present in each lane and expressed as percentage of control. (B) 50 µg of total protein analysed by immunoblotting using antibodies to phosphorylated – p65 and β-actin. (C) cDNA was synthesized from total mRNA extracted and the expression of SOCS-1. (D) MyD88 mRNA was analysed by RT-PCR. mRNA expression levels were calculated by the comparative Ct method and normalized to GAPDH levels with non-diabetic CLP given an arbitrary value of one. n = 5/group, data were presented as mean ± SEM.* P<0.05; ***, P<0.001.

References

    1. Fernandez-Valverde SL, Taft RJ, Mattick JS (2011) MicroRNAs in beta-cell biology, insulin resistance, diabetes and its complications. Diabetes 60: 1825–1831. - PMC - PubMed
    1. Alba-Loureiro TC, Munhoz CD, Martins JO, Cerchiaro GA, Scavone C, et al. (2007) Neutrophil function and metabolism in individuals with diabetes mellitus. Braz J Med Biol Res 40: 1037–1044. - PubMed
    1. Ferracini M, Martins JO, Campos MR, Anger DB, Jancar S (2010) Impaired phagocytosis by alveolar macrophages from diabetic rats is related to the deficient coupling of LTs to the Fc gamma R signaling cascade. Mol Immunol 47: 1974–1980. - PubMed
    1. Spiller F, Carlos D, Souto FO, de Freitas A, Soares FS, et al. (2012) alpha1-Acid glycoprotein decreases neutrophil migration and increases susceptibility to sepsis in diabetic mice. Diabetes 61: 1584–1591. - PMC - PubMed
    1. Geerlings SE, Hoepelman AI (1999) Immune dysfunction in patients with diabetes mellitus (DM). FEMS Immunol Med Microbiol 26: 259–265. - PubMed

Publication types

MeSH terms