

CD80 and CD86 differentially regulate mechanical interactions of T-cells with antigen-presenting dendritic cells and B-cells
- PMID: 23024807
- PMCID: PMC3443229
- DOI: 10.1371/journal.pone.0045185
CD80 and CD86 differentially regulate mechanical interactions of T-cells with antigen-presenting dendritic cells and B-cells
Abstract
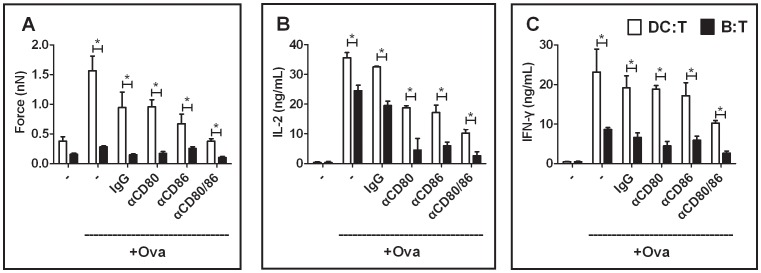
Functional T-cell responses are initiated by physical interactions between T-cells and antigen-presenting cells (APCs), including dendritic cells (DCs) and B-cells. T-cells are activated more effectively by DCs than by B-cells, but little is known about the key molecular mechanisms that underpin the particular potency of DC in triggering T-cell responses. To better understand the influence of physical intercellular interactions on APC efficacy in activating T-cells, we used single cell force spectroscopy to characterize and compare the mechanical forces of interactions between DC:T-cells and B:T-cells. Following antigen stimulation, intercellular interactions of DC:T-cell conjugates were stronger than B:T-cell interactions. DCs induced higher levels of T-cell calcium mobilization and production of IL-2 and IFNγ than were elicited by B-cells, thus suggesting that tight intercellular contacts are important in providing mechanically stable environment to initiate T-cell activation. Blocking antibodies targeting surface co-stimulatory molecules CD80 or CD86 weakened intercellular interactions and dampen T-cell activation, highlighting the amplificatory roles of CD80/86 in regulating APC:T-cell interactions and T-cell functional activation. The variable strength of mechanical forces between DC:T-cells and B:T-cell interactions were not solely dependent on differential APC expression of CD80/86, since DCs were superior to B-cells in promoting strong interactions with T-cells even when CD80 and CD86 were inhibited. These data provide mechanical insights into the effects of co-stimulatory molecules in regulating APC:T-cell interactions.
Conflict of interest statement
Figures
Similar articles
-
Dendritic type, accessory cells within the mammalian thymic microenvironment. Antigen presentation in the dendritic neuro-endocrine-immune cellular network.In Vivo. 1997 Jul-Aug;11(4):351-70. In Vivo. 1997. PMID: 9292303
-
Treg-expressed CTLA-4 depletes CD80/CD86 by trogocytosis, releasing free PD-L1 on antigen-presenting cells.Proc Natl Acad Sci U S A. 2021 Jul 27;118(30):e2023739118. doi: 10.1073/pnas.2023739118. Proc Natl Acad Sci U S A. 2021. PMID: 34301886 Free PMC article.
-
Abatacept modulates CD80 and CD86 expression and memory formation in human B-cells.J Autoimmun. 2019 Jul;101:145-152. doi: 10.1016/j.jaut.2019.04.016. Epub 2019 May 1. J Autoimmun. 2019. PMID: 31054942
-
The role of dendritic cells in T cell activation.Immunol Cell Biol. 1997 Jun;75(3):223-30. doi: 10.1038/icb.1997.35. Immunol Cell Biol. 1997. PMID: 9243286 Review.
-
Dendritic cells, T cells and their interaction in rheumatoid arthritis.Clin Exp Immunol. 2019 Apr;196(1):12-27. doi: 10.1111/cei.13256. Epub 2019 Jan 21. Clin Exp Immunol. 2019. PMID: 30589082 Free PMC article. Review.
Cited by
-
Reprogramming the anti-tumor immune response via CRISPR genetic and epigenetic editing.Mol Ther Methods Clin Dev. 2021 Apr 24;21:592-606. doi: 10.1016/j.omtm.2021.04.009. eCollection 2021 Jun 11. Mol Ther Methods Clin Dev. 2021. PMID: 34095343 Free PMC article. Review.
-
Genome-wide association study of antibody response to Newcastle disease virus in chicken.BMC Genet. 2013 May 10;14:42. doi: 10.1186/1471-2156-14-42. BMC Genet. 2013. PMID: 23663563 Free PMC article.
-
Resolvin E1 Regulates Th17 Function and T Cell Activation.Front Immunol. 2021 Mar 17;12:637983. doi: 10.3389/fimmu.2021.637983. eCollection 2021. Front Immunol. 2021. PMID: 33815391 Free PMC article.
-
Regulation of biomaterial implantation-induced fibrin deposition to immunological functions of dendritic cells.Mater Today Bio. 2022 Feb 26;14:100224. doi: 10.1016/j.mtbio.2022.100224. eCollection 2022 Mar. Mater Today Bio. 2022. PMID: 35252832 Free PMC article.
-
Pediatric Mesenchymal Stem Cells Exhibit Immunomodulatory Properties Toward Allogeneic T and B Cells Under Inflammatory Conditions.Front Bioeng Biotechnol. 2019 Jun 12;7:142. doi: 10.3389/fbioe.2019.00142. eCollection 2019. Front Bioeng Biotechnol. 2019. PMID: 31245368 Free PMC article.
References
Publication types
MeSH terms
Substances
LinkOut - more resources
Full Text Sources
Miscellaneous
