. 2012 Sep 1;3(9):2326-38.
doi: 10.1364/BOE.3.002326. Epub 2012 Aug 30.

On the use of photoacoustics to detect red blood cell aggregation

Affiliations

On the use of photoacoustics to detect red blood cell aggregation

Eno Hysi et al. Biomed Opt Express. .

Abstract

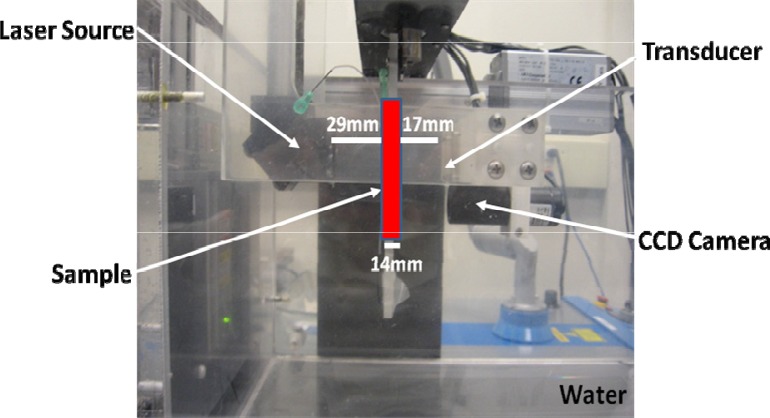
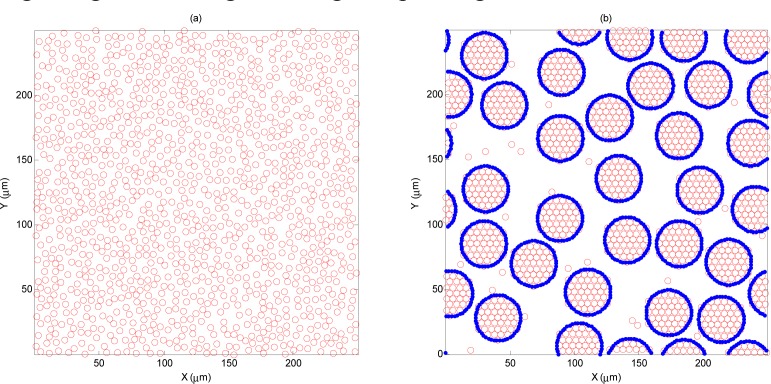
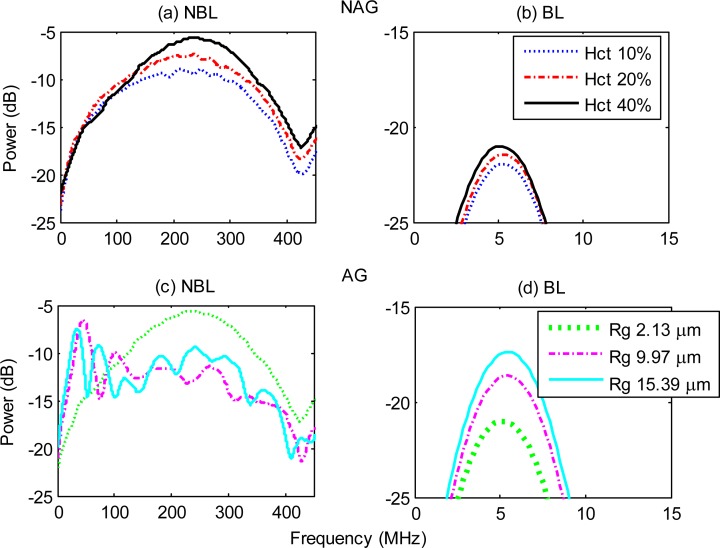
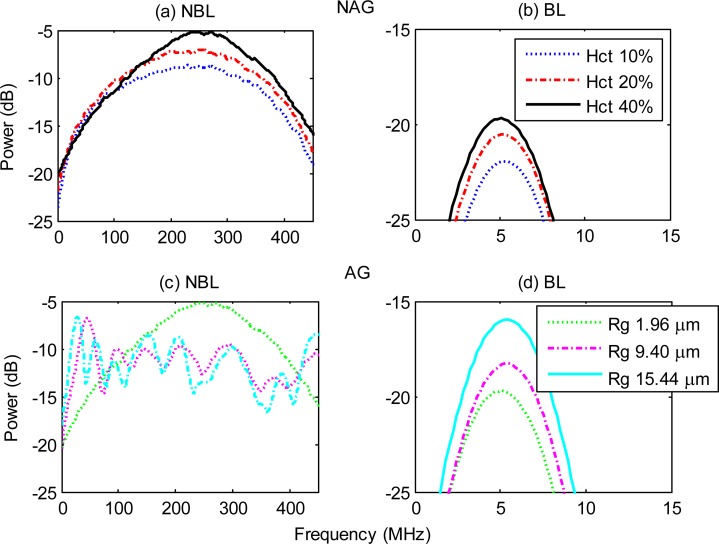
The feasibility of detecting red blood cell (RBC) aggregation with photoacoustics (PAs) was investigated theoretically and experimentally using human and porcine RBCs. The theoretical PA signals and spectra generated from such samples were examined for several hematocrit levels and aggregates sizes. The effect of a finite transducer bandwidth on the received PA signal was also examined. The simulation results suggest that the dominant frequency of the PA signals from non-aggregated RBCs decreases towards clinical frequency ranges as the aggregate size increases. The experimentally measured mean spectral power increased by ~6 dB for the largest aggregate compared to the non-aggregated samples. Such results confirm the theoretical predictions and illustrate the potential of using PA imaging for detecting RBC aggregation.

Keywords: (110.5125) Photoacoustics; (170.1470) Blood or tissue constituent monitoring.


Figures

Fig. 1
Fig. 1
Imagio PA imaging device components.
Fig. 2
Fig. 2
Representative (a) NAG and (b) AG p-RBC configurations simulated in this study. For both cases the hematocrit is 40% and for the aggregated case, Rg is 12.24 µm.
Fig. 3
Fig. 3
Simulated PA RF power spectra for NAG (top row) and AG (bottom row) h-RBCs. Panel (a) and (c) show the NBL spectra while panels (b) and (d) are the BL spectra. Hct stands for hematocrit and Rg represents the radius of gyration (used to denote aggregate size). The hematocrit for the AG RBCs was 40%.
Fig. 4
Fig. 4
Simulated PA RF power spectra for NAG (top row) and AG (bottom row) p-RBCs. Panels (a) and (c) show the NBL spectra while panels (b) and (d) are the BL spectra. Hct stands for hematocrit and Rg represents the radius of gyration (used to denote aggregate size). The hematocrit for the AG RBCs was 40%.
Fig. 5
Fig. 5
Effect of [Dextran-PBS] on the viscosity of h-RBC samples. The error bars (too small to be seen) represent the standard deviation of the viscosity measurements taken over 1 minute at a constant shear rate. The hematocrit level of all samples is 40%.
Fig. 6
Fig. 6
(a) PA signal amplitude, (b) mean spectral power and (c) correlation between the signal amplitude and viscosity for h-RBCs at 40% hematocrit. The arrows in (c) denote the [Dextran-PBS] for which the PA signal amplitude and viscosity was measured. The error bars for the PA signal amplitude and mean power denote the standard deviation of 20 PA signals and power spectra.
Fig. 7
Fig. 7
(a) PA signal amplitude and (b) mean spectral power for p-RBCs. The error bars for the PA signal amplitude and mean power denote the standard deviation of 20 PA signals and power spectra.

References

    1. O. K. Baskurt, B. Neu, and H. J. Meiselman, Red Blood Cell Aggregation (CRC Press, Boca Raton, FL, 2011).
    1. Uyuklu M., Canpolat M., Meiselman H. J., Baskurt O. K., “Wavelength selection in measuring red blood cell aggregation based on light transmittance,” J. Biomed. Opt. 16(11), 117006 (2011).10.1117/1.3652712 - DOI - PMC - PubMed
    1. Meiselman H. J., “Red blood cell aggregation: 45 years being curious,” Biorheology 46(1), 1–19 (2009). - PubMed
    1. Johnson P. C., Bishop J. J., Popel S., Intaglietta M., “Effects of red cell aggregation on the venous microcirculation,” Biorheology 36(5-6), 457–460 (1999). - PubMed
    1. O. K. Baskurt, M. R. Hardeman, M. W. Rampling, and H. J. Meiselman, Handbook of Hemorheology and Hemodynamics (IOS Press, Amsterdam, 2007).

LinkOut - more resources