. 2012 Nov 2;11(11):5221-34.
doi: 10.1021/pr300411q. Epub 2012 Oct 15.

Addressing statistical biases in nucleotide-derived protein databases for proteogenomic search strategies

Affiliations
Free PMC article

Addressing statistical biases in nucleotide-derived protein databases for proteogenomic search strategies

Paul Blakeley et al. J Proteome Res. .
Free PMC article

Abstract

Proteogenomics has the potential to advance genome annotation through high quality peptide identifications derived from mass spectrometry experiments, which demonstrate a given gene or isoform is expressed and translated at the protein level. This can advance our understanding of genome function, discovering novel genes and gene structure that have not yet been identified or validated. Because of the high-throughput shotgun nature of most proteomics experiments, it is essential to carefully control for false positives and prevent any potential misannotation. A number of statistical procedures to deal with this are in wide use in proteomics, calculating false discovery rate (FDR) and posterior error probability (PEP) values for groups and individual peptide spectrum matches (PSMs). These methods control for multiple testing and exploit decoy databases to estimate statistical significance. Here, we show that database choice has a major effect on these confidence estimates leading to significant differences in the number of PSMs reported. We note that standard target:decoy approaches using six-frame translations of nucleotide sequences, such as assembled transcriptome data, apparently underestimate the confidence assigned to the PSMs. The source of this error stems from the inflated and unusual nature of the six-frame database, where for every target sequence there exists five "incorrect" targets that are unlikely to code for protein. The attendant FDR and PEP estimates lead to fewer accepted PSMs at fixed thresholds, and we show that this effect is a product of the database and statistical modeling and not the search engine. A variety of approaches to limit database size and remove noncoding target sequences are examined and discussed in terms of the altered statistical estimates generated and PSMs reported. These results are of importance to groups carrying out proteogenomics, aiming to maximize the validation and discovery of gene structure in sequenced genomes, while still controlling for false positives.


Figures

Figure 1
Figure 1
Schematic of EST translation for target:decoy database generation. Translation of transcriptome data such as ESTs in all six reading frames increases the proportion of ‘junk’ sequence. In this simplified model, only one of the six reading frames is correct (sequence A in frame 2). Sequences denoted by “B” are in the correct direction and therefore in some circumstances could constitute part of the correct ORF as a result of pre-mRNA splicing or frameshift errors. Sequences denoted by “C“ are in the wrong direction and are therefore incorrect. Decoy sequences are created by reversing the six corresponding target six sequences, so that decoy1 is the reverse of B1, decoy 2 the reverse of A2, and so on.
Figure 2
Figure 2
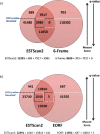
Overlap of peptides identified in pairwise database searches Overlap of unique peptide sequences derived from PSMs in the searches against: (a) the ESTScan2 and six-frame databases, (b) ESTScan2 and EORF databases. In both cases, FDRKallq-value cut-offs of 0.01 for the various searches are indicated by dotted lines, black for ESTScan2 and white for the six-frame or EORF searches. PSMs are sorted by Mascot score from low scores (bottom) to high scores (top). The majority of the unique accepted peptides identified in ESTScan2 but missed by the six-frame database were present on both databases but have q-values that exceed the threshold six-frame q-value threshold.
Figure 3
Figure 3
Variation of search statistics with Mascot score. Plots show the calculated q-values and PEPs for PSMs from different proteogenomic database searches and their dependence on Mascot ion score. (a) Mascot Scores of equivalent PSMs from two independent database searches are plotted, in this case ESTScan vs six-frame, although identical plots were obtained for all pairwise comparisons. (b) The q-values calculated using FDRKall are plotted against Mascot ion score, (c) PEPs calculated using Qvality, and (d) q-values calculated from Qvality, for different database search combinations. In the key, 6F denotes the six-frame searches.
Figure 4
Figure 4
Estimating the proportion of true positive PSMs identified in the six-frame database search. PSMs were considered to be ‘correct’ if the reading frame contained the top-scoring match to an Ensembl56 protein through a BLASTX search. Plots show: (a) the percentage of ‘correct’ reading frame PSMs that fall below each of the three types of q-values and PEP, and (b) the same percentage but plotted for local qvality PEP bins of 0.01.
Figure 5
Figure 5
Mascot ion score distributions for reported target and decoy PSMs. Plots show reported target and decoy PSMs ion score distributions, for all rank 1 PSMs, when target and decoy databases were searched separately. Density plots were generated for: (a) standard six-frame database search, (b) ESTScan2 search, and (c) EORF search. The number of reported PSMs from searches of 403 820 spectra against the individual databases are also shown, demonstrating how fewer spectra are matched by Mascot for the smaller, ESTScan and EORF databases.
Figure 6
Figure 6
Effect of database size on FDR of the six-frame PSMs. Subsets of sizes equal to the ESTScan2 database were randomly sampled (1000 times) from six-frame database. The mean q-values were calculated from the samples to give an FDR profile with FDRs greater than the ESTScan2 PSMs, but lower than the six-frame PSMs.
Figure 7
Figure 7
Comparison of equivalent PEPs from standard six-frame searches against alternate database searches. PEPs derived from several search strategies are plotted against the six-frame equivalents, with the same sequence-spectra-Mascot score. (a) PEPs derived from simple filtering approaches based on selection of a single frame by: random (random-frame), the most PSMs (top-hit PSM), or the three forward frames, are plotted against the six-frame PEP values. (b) PEPs derived from searches against the six-frame-predicted, ESTScan2 and EORF databases are plotted against the six-frame equivalents. In both plots, direct equivalence of PEP values against the standard six-frame database searches is shown as a dashed line. In all cases, selection of single frames, three forward frames, frame prediction and/or translation by EORF or ESTScan reduces the estimated PEP.

References

    1. Nagaraj N.; Kulak N. A.; Cox J.; Neuhaus N.; Mayr K.; Hoerning O.; Vorm O.; Mann M. Systems-wide perturbation analysis with near complete coverage of the yeast proteome by single-shot UHPLC runs on a bench-top Orbitrap. Mol. Cell. Proteomics 2012, 11(3), M111.013722. - PMC - PubMed
    1. Schrimpf S. P.; Weiss M.; Reiter L.; Ahrens C. H.; Jovanovic M.; Malmstroem J.; Brunner E.; Mohanty S.; Lercher M. J.; Hunziker P. E.; Aebersold R.; von Mering C.; Hengartner M. O. Comparative functional analysis of the Caenorhabditis elegans and Drosophila melanogaster proteomes. PLoS Biol. 2009, 7(3), e48. - PMC - PubMed
    1. Chaerkady R.; Kelkar D. S.; Muthusamy B.; Kandasamy K.; Dwivedi S. B.; Sahasrabuddhe N. A.; Kim M. S.; Renuse S.; Pinto S. M.; Sharma R.; Pawar H.; Sekhar N. R.; Mohanty A. K.; Getnet D.; Yang Y.; Zhong J.; Dash A. P.; Maccallum R. M.; Delanghe B.; Mlambo G.; Kumar A.; Keshava Prasad T. S.; Okulate M.; Kumar N.; Pandey A. A proteogenomic analysis of Anopheles gambiae using high-resolution Fourier transform mass spectrometry. Genome Res. 2011, 21(11), 1872–1881. - PMC - PubMed
    1. Castellana N. E.; Payne S. H.; Shen Z. X.; Stanke M.; Bafna V.; Briggs S. P. Discovery and revision of Arabidopsis genes by proteogenomics. Proc. Natl. Acad. Sci. U.S.A. 2008, 105(52), 21034–21038. - PMC - PubMed
    1. Merrihew G. E.; Davis C.; Ewing B.; Williams G.; Kall L.; Frewen B. E.; Noble W. S.; Green P.; Thomas J. H.; MacCoss M. J. Use of shotgun proteomics for the identification, confirmation, and correction of C. elegans gene annotations. Genome Res. 2008, 18(10), 1660–1669. - PMC - PubMed

Publication types