. 2013:931:1-27.
doi: 10.1007/978-1-62703-056-4_1.

Digital images are data: and should be treated as such

Affiliations

Digital images are data: and should be treated as such

Douglas W Cromey. Methods Mol Biol. 2013.

Abstract

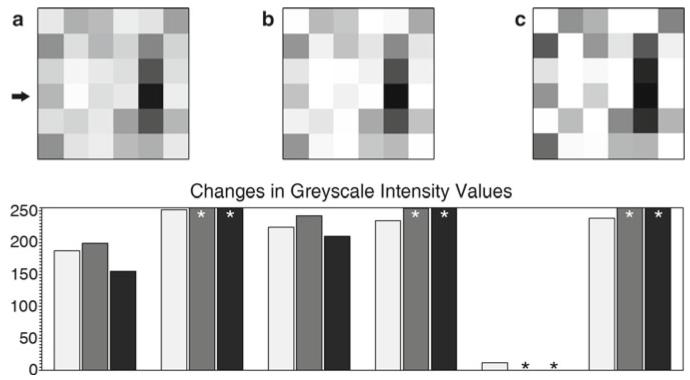
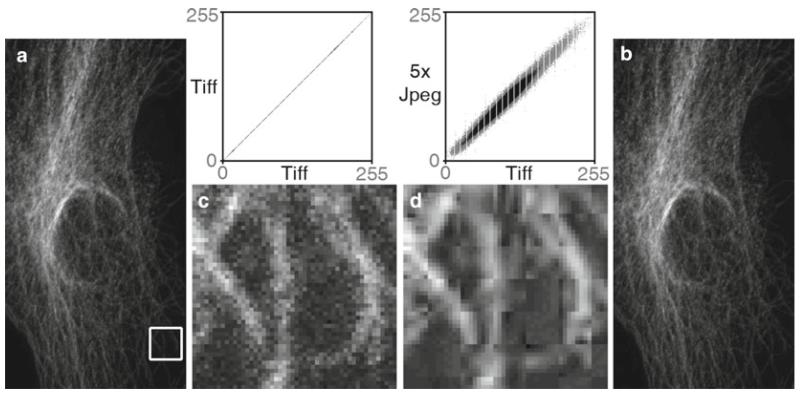
The scientific community has become very concerned about inappropriate image manipulation. In journals that check figures after acceptance, 20-25% of the papers contained at least one figure that did not comply with the journal's instructions to authors. The scientific press continues to report a small, but steady stream of cases of fraudulent image manipulation. Inappropriate image manipulation taints the scientific record, damages trust within science, and degrades science's reputation with the general public. Scientists can learn from historians and photojournalists, who have provided a number of examples of attempts to alter or misrepresent the historical record. Scientists must remember that digital images are numerically sampled data that represent the state of a specific sample when examined with a specific instrument. These data should be carefully managed. Changes made to the original data need to be tracked like the protocols used for other experimental procedures. To avoid pitfalls, unexpected artifacts, and unintentional misrepresentation of the image data, a number of image processing guidelines are offered.


Figures

Fig. 1
Fig. 1
US President Franklin D. Roosevelt was photographed thousands of times during his long political career. Most of the photographs show him seated, or if he was shown standing he was frequently holding onto someone or something. According to the FDR Library (112), Roosevelt’s paralysis was concealed (with the cooperation of the press) for political reasons, since at the time disabled persons were not considered able to perform the demanding responsibilities of elected Office. Because the images the public routinely saw of Roosevelt did not hint of a physical limitation, the vast majority of the public was unaware that Roosevelt was paralyzed from the waist down (see Subheading 3.2). (a) Joseph Stalin (USSR), Franklin D. Roosevelt (USA), and Winston Churchill (UK) at the Tehran Conference, Teheran, Iran. November 29, 1943 (courtesy of the Franklin Delano Roosevelt Library website, Library ID 48-22 3715-107, Public Domain image). (b) Franklin D. Roosevelt in a wheelchair with his dog Fala in his lap, also pictured is family friend Ruthie Bie. Hyde Park, NY, February 1941 (courtesy of the Franklin Delano Roosevelt Library website, Library ID 73-113 61, Photographer: Margaret Suckley. Public Domain image).
Fig. 2
Fig. 2
US sports and television personality OJ Simpson was arrested and accused of murdering his wife in June 1994. He was later acquitted of the charges. Newsweek and Time magazines both used the same Los Angeles Police Department booking photograph on the covers of the June 27, 1994 issues of their respective magazines. The heavily manipulated Time magazine cover (c) was seen by many as making Mr. Simpson appear more “sinister” (42) (see Subheading 3.3). (a) Original public domain image as found at the Washington Post website (113). (b) Color adjusted to more closely resemble the Newsweek cover. (c) Multiple image manipulations were performed to have the image more closely resemble the Time cover. To color match the images, regions were sampled from an image of the respective magazine covers (not shown) and the original image (a) was adjusted to match using the hue/saturation tool in Adobe Photoshop® CS3 to create the derivative images (b, c). The right image (c) was then colorized using the hue/saturation tool, the curves tool was used to darken the image, then a Gaussian blur (radius = 2.0) was applied, followed by setting the overall gamma to 0.85 in the levels tool to darken the image further, then selecting the background and lightening it using a gamma of 1.5. Photograph provided to the press on June 17, 1994 by the Los Angeles Police Department, Los Angeles, CA. Time magazine’s legal department would not grant permission for the magazine cover to be reproduced here.
Fig. 3
Fig. 3
Digital images are a representative sampling of real life at discrete points (pixels). To ensure that the image correctly captures all the smallest details in the specimen, the Nyquist/Shandon theories suggest a minimum of 2× oversampling of the smallest resolvable element, with 2.4–2.8× oversampling suggested by some (55). Failure to adequately oversample can cause aliasing artifacts. Image (b) shows correct sampling and image (c) shows the same field undersampled. Note that in image (c) it is no longer possible to accurately count the number of visible in situ hybridization spots (see Subheadings 5.2, 5.3, 6.9, and 6.10). (a) Image captured at 2,048 × 2,048 pixels representing a field of view of 225 by 225 μm. The image was cropped to fit the page. (b) 2× enlargement of the field represented by the white box. Enlarged using Adobe Photoshop® CS3’s nearest neighbor resampling algorithm. (c) 2× enlargement of the same area, but taken from an image (not shown) that was captured at 512 × 512 pixels to represent the same field of view. Enlarged in the same manner as (b). Ciona intestinalis embryos, in situ hybridization stain, image captured with a Zeiss LSM 510 confocal microscope. These images are used by permission of Ella Starobinska and Dr. Bradley Davidson, University of Arizona.
Fig. 4
Fig. 4
Temporal aliasing is a mismatch between the speed of the object and the speed of the camera (incorrect temporal sampling). The “wagon wheel effect” (also known as the “stroboscopic effect”) became familiar to viewers of Western movies as far back as the silent movie era (58). In the above illustration, the timing of each image is such that the wagon wheel has only rotated 94.5% of a turn (340°) per frame. When the video is played back, the wheel will appear to rotate in a clockwise direction, when in reality it is rotating counterclockwise (based on the indicated direction of travel, large arrow). Exploiting this artifact, a video could be created that showed an automobile obviously moving forward while the wheels appeared to be stationary, or a helicopter flying without the rotor turning (http://www.youtube.com/watch?v=Xh-sf6vwSMc). Given the misleading possibilities of this artifact, it is important to know how quickly things are changing in a sample and to oversample correctly (see Subheadings 5.2 and 6.9). Dr. David Elliott, University of Arizona, provided technical assistance with this figure.
Fig. 5
Fig. 5
Rotating, as well as enlarging or reducing the image size (total number of pixels), causes the intensity values in an image to be resampled using interpolation (Merriam-Webster “to estimate values of (data or a function) between two known values” (114)). Rotating and/or resizing an image may be necessary for reporting the image data in a publication; however, this interpolation of the data should only be performed once on an image to avoid the compounding of interpolation artifacts (see Subheading 6.10). It is important to be very careful when using Adobe Photoshop®’s powerful image size dialog box, since it is very easy to accidentally resample an image with this tool (93). (a) A 6 × 6 pixel array. (b) A 15° rotation overlaid on the original image. (c) The result of the 15° rotation. (d) A 10 × 10 array is overlaid on the original image prior to enlarging the image. (e) The result of the 10 × 10 enlargement. Fifteen degree rotation performed using the Adobe Photoshop® CS3 Edit | Transform | Rotation tool. Enlargement performed using the Adobe Photoshop® CS3 Image Size dialog box, using the “bicubic smoother (better for enlargement)” resizing algorithm.
Fig. 6
Fig. 6
(a) Six by six pixel array (see Fig. 5a). Pixels have discrete intensity values, positional information within the array, and may imply a three-dimensional voxel (volume element). (b) The same array as (a) after a moderately aggressive brightness and contrast adjustment using ImageJ 1.43 m (115). (c) The same array as (a) after applying the Adobe Photoshop® CS3 sharpen filter. Graph: (key: light grey = (a), medium grey = (b), black = (c)). The graph shows the intensity values of the fourth row of pixels (arrow) in the images. The original image contains values that fit within the range of 0–255 (black-white). After the brightness and contrast adjustment, or the sharpening filter, a number of the intensity values have been truncated (asterisk) since they exceeded the 0–255 range, leaving just the maximum or minimum values. The relationship of these truncated values to those of the neighboring pixels has been lost (see Subheadings 6.1 and 6.5).
Fig. 7
Fig. 7
The dangers of the JPEG file format. A TIFF image (a) was opened and saved as a JPEG file, then the JPEG was opened and saved as a JPEG a total of five times in a row (Adobe Photoshop® CS3’s “medium” JPEG setting, 5). Each time a JPEG file is saved, the compression algorithm is performed. The white box in the TIFF (a) image and the corresponding area in the JPEG image (b) were enlarged seven times using Adobe Photoshop’s® nearest neighbor resampling algorithm to show the compression artifacts (with a histogram stretch and gamma set to 1.5). Image (c) is the enlarged TIFF, and image (d) is the enlarged JPEG. Comparing image (a, b), there appears to be no visible change, but at the pixel level ((c) vs. (d)), the changes are very noticeable. The scatter plots illustrate the differences between the files. The plot compares the grey values of each pixel in both images. The TIFF images are identical, hence the straight line. The intensity values are quite different in the JPEG image. The gaps in the plots are due to an initial histogram stretch of the original TIFF image. The original TIFF file size is 204 kB, the first JPEG save is 36 kB and JPEG files 2–5 are all 35 kB. The Pearson’s correlation of TIFF vs. TIFF is 1.0, the correlation of TIFF vs. the first JPEG save is 0.991, with the correlation between subsequent JPEG saves being 0.99. The first JPEG save causes the biggest changes in the image and saves the most file space, and after that the subsequent saves degrade the image slightly each time. Saving the TIFF file one time at the highest JPEG quality factor (, Adobe Photoshop®) reduced the file size to 123 kB and yielded a tighter, but not perfectly linear, scatterplot (data not shown). If JPEG is required, saving once at the highest quality factor makes the smallest change in the image (see Subheading 6.8). Confocal microscope image of cellular cytoskeleton (this figure was inspired by colleague Charles “Chip” Hedgcock, University of Arizona, and the colocalization technique was suggested by Dr. John Krueger, ORI).

References

    1. Rossner M, Held MJ, Bozuwa GP, et al. Managing editors and digital images: shutter diplomacy. CBE Views. 1998;21:187–192.
    1. Rossner M, Yamada KM. What’s in a picture? The temptation of image manipulation. J Cell Biol. 2004;166:11–15. - PMC - PubMed
    1. Rossner M. How to guard against image fraud. Scientist. 2006;20:24.
    1. Rossner M. A false sense of security. J Cell Biol. 2008;183:573–574. - PMC - PubMed
    1. Marris E. Should journals police scientific fraud? Nature. 2006;439:520–521. - PubMed

Publication types

LinkOut - more resources