

A guanidine-rich regulatory oligodeoxynucleotide improves type-2 diabetes in obese mice by blocking T-cell differentiation
- PMID: 23027613
- PMCID: PMC3491840
- DOI: 10.1002/emmm.201201272
A guanidine-rich regulatory oligodeoxynucleotide improves type-2 diabetes in obese mice by blocking T-cell differentiation
Abstract
T lymphocytes exhibit pro-inflammatory or anti-inflammatory activities in obesity and diabetes, depending on their subtypes. Guanidine-rich immunosuppressive oligodeoxynucleotides (ODNs) effectively control Th1/Th2-cell counterbalance. This study reveals a non-toxic regulatory ODN (ODNR01) that inhibits Th1- and Th17-cell polarization by binding to STAT1/3/4 and blocking their phosphorylation without affecting Th2 and regulatory T cells. ODNR01 improves glucose tolerance and insulin sensitivity in both diet-induced obese (DIO) and genetically generated obese (ob/ob) mice. Mechanistic studies show that ODNR01 suppresses Th1- and Th17-cell differentiation in white adipose tissue, thereby reducing macrophage accumulation and M1 macrophage inflammatory molecule expression without affecting M2 macrophages. While ODNR01 shows no effect on diabetes in lymphocyte-free Rag1-deficient DIO mice, it enhances glucose tolerance and insulin sensitivity in CD4(+) T-cell-reconstituted Rag1-deficient DIO mice, suggesting its beneficial effect on insulin resistance is T-cell-dependent. Therefore, regulatory ODNR01 reduces obesity-associated insulin resistance through modulation of T-cell differentiation.
Copyrights © 2012 The Authors. Published by John Wiley and Sons, Ltd on behalf of EMBO.
Figures
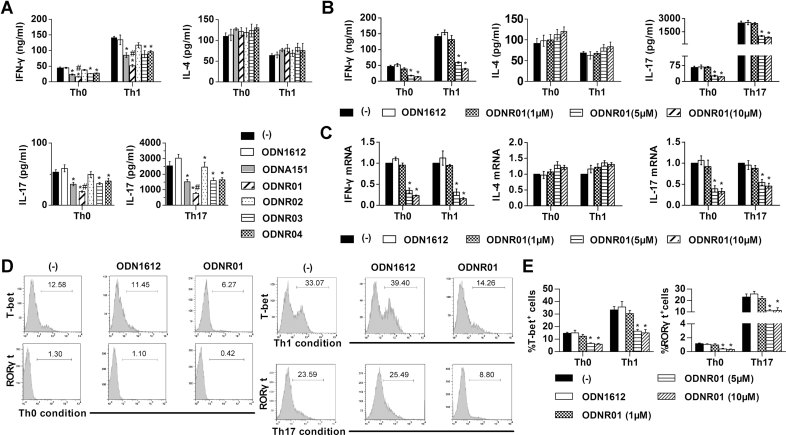
CD4+ T-cell culture media IFN-γ, IL-4 and IL-17 levels as determined by ELISA. CD4+ T cells were treated with anti-CD3 and anti-CD28 mAb with or without (−) 5 µM of the different regulatory ODNs under Th0, Th1 or Th17 conditions for 3 days. Immunosuppressive ODNA151 was used as a positive control, and random ODN1612 was used as a negative control. *p < 0.05 versus (−) and ODN1612; #p < 0.05 versus ODNA151.
ELISA determined CD4+ T-cell culture media IFN-γ, IL-4 and IL-17 levels after cells were cultured with or without ODN1612 (5 µM) and different doses of ODNR01 (1, 5 and 10 µM) under Th0, Th1 or Th17 conditions. *p < 0.05 versus (−) and ODN1612.
RT-PCR determined CD4+ T-cell IFN-γ, IL-4 and IL-17 mRNA levels after cells were treated as in B. *p < 0.05 versus (−) and ODN1612.
Representative FACS histograms of Th1 and Th17 cells for purified CD4+ T cells treated under Th0, Th1 or Th17 conditions with or without ODN (5 µM) for 4 days. Lymphocytes were first gated on the SSC/FSC plots and then the expression of T-bet and RORγt on the purified CD4+ T cells was analyzed.
Th1- or Th17-cell frequencies in CD4+ T cells after cells were treated with ODNs as in B for 4 days, *p < 0.05 versus (−) and ODN1612. Data are representative of three independent experiments.
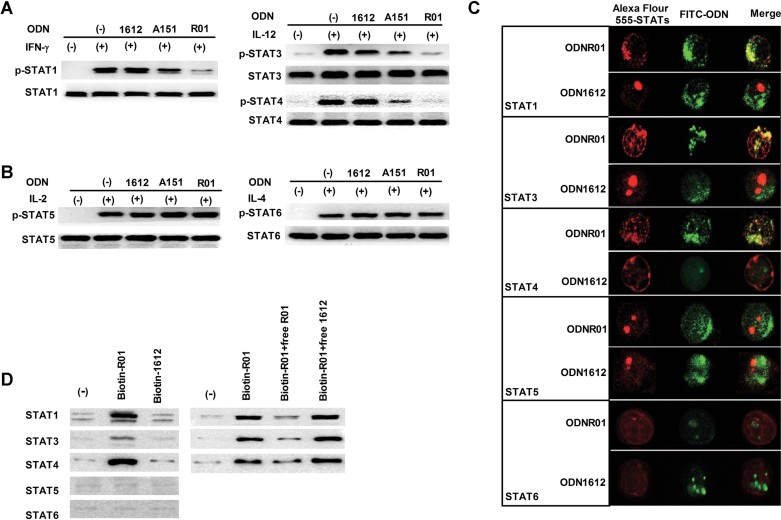
A,B. STAT and phospho-STAT Western blot analysis of anti-CD3/28 mAb-stimulated CD4+ T cells treated with indicated cytokines, with and without 5 µM of ODNR01, ODNA151 or ODN1612.
C. Confocal microscopy to detect co-localization of FITC-conjugated ODNs (2.5 µM; green) with different Alex Fluor 555-conjugated anti-STAT rabbit polyclonal antibodies (red) in CD4+ T cells after 24 h of incubation.
D. Left panels: Immunoblot analysis of STATs from CD4+ T cells pre-incubated with 5 µM biotinylated-ODNs, lysed, and precipitated with avidin agarose beads for STAT detection. Right panels: Immunoblot analysis of STATs from CD4+ T-cell lysates that were pre-incubated with 1 µM biotinylated ODN and 5 µM unlabelled ODN for 1 h and immunoprecipitated with avidin beads for detection of different STAT. The experiments were repeated three times with similar results.

A. Body weight gain in DIO mice (on a high-fat diet, HFD) and ob/ob mice (on a normal chow diet, NCD) treated with ODNR01, negative control ODN1612 or PBS for indicated weeks (one dose/2 weeks).
B-E. VAT and SAT fat mass (B), VAT adipocyte sizes (C), serum insulin levels (D), and glucose and insulin tolerance (E) from DIO mice and ob/ob mice at the end of treatment. *p < 0.05, **p < 0.01, n = 7∼8 mice per group.

Representative FACS plots of Th1, Th2, Th17 and Treg cells in VAT from DIO mice treated with different ODNs. CD4+ T cells were first gated on the SSC/CD4 plots, and then the expression of IFN-γ, IL-4, IL-17 and Foxp3 was analyzed in the gated CD4+ T cells.
The frequencies of Th1, Th2, Th17 and Treg cells in VAT, SAT and spleen from DIO mice treated with different ODNs.
ELISA determined serum IFN-γ, IL-4 and IL-17 concentrations in DIO mice treated with different ODNs.
RT-PCR determined mRNA levels of transcription regulators (T-bet, GATA-3, RORγt and Foxp3) in sorted CD4+ T cells from VAT, SAT and spleen of DIO mice treated with different ODNs. *p < 0.05, **p < 0.01, ND: not detectable, n = 6∼8 mice per group.
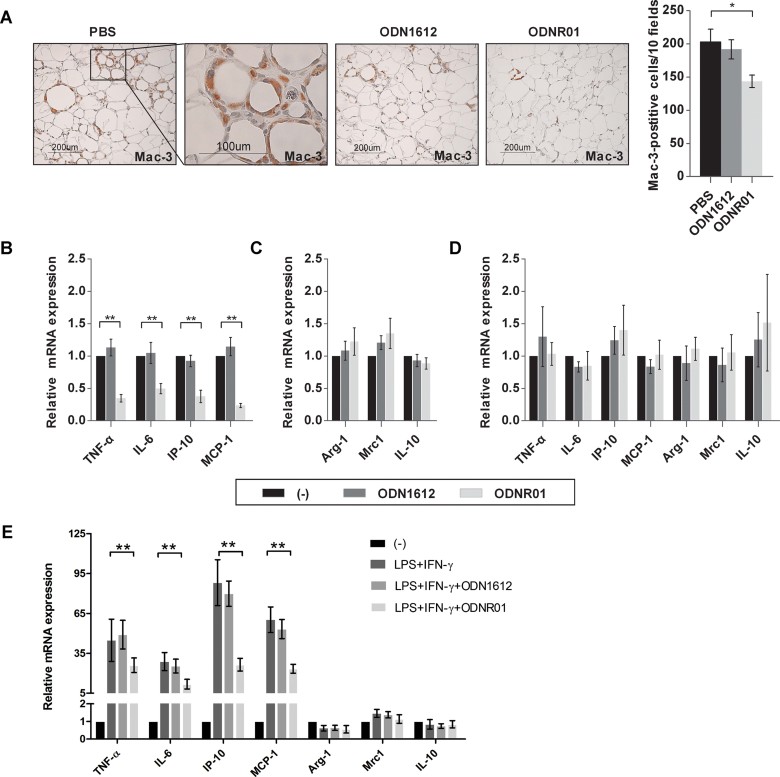
A. Immunostaining of VAT with rat anti-mouse Mac-3 mAb. Graph represents the number of Mac-3+ cells in each 10 fields.
B-E. RT-PCR determined mRNA levels of (B) M1 markers (TNF-α, IL-6, IP-10 and MCP-1) and (C) M2 markers (Arg1, Mrc1 and IL-10) in VAT after normalizing to GAPDH. Fold change was calculated relative to PBS group. RT-PCR determined mRNA levels (normalized to GAPDH) of M1 markers (TNF-α, IL-6, IP-10 and MCP-1) and M2 markers (Arg1, Mrc1 and IL-10) in untreated BMDMs (D) or BMDMs that were stimulated with LPS (10 ng/ml) and IFN-γ (100 U/ml) for 24 h (E), with or without 5 µM ODNR01 or ODN1612. Fold change was calculated relative to medium group (−). Data represent three independent experiments. *p < 0.05; **p < 0.01, n = 4∼6.

Rag1−/− mouse body weight at 8 weeks or after consuming 18 weeks of a HFD along with ODNR01 or ODN1612 treatment (one dose/2 weeks), glucose tolerance test (GTT) and insulin tolerance test (ITT) at the end of HFD and ODN treatment.
FACS plots to detect CD3+CD4+ T cells in VAT, SAT and spleen from Rag1−/− mice that consumed HFD for 18 weeks (no ODN treatments), then received WT naive CD4+ T-cell intraperitoneal transfer (5 × 10⁶ mouse−1) at week 26 and consumed HFD for an additional 4 weeks while receiving ODN treatments.
Body weight of Rag1−/− recipients from B.
GTT, ITT and serum insulin levels in Rag1−/− recipients from B.
GTT, ITT and serum insulin levels from Rag1−/− mice that consumed a HFD for 18 weeks (no ODN treatments), received adoptive transfer of in vitro ODN-treated WT CD4+ T cells, and consumed a HFD for another 4 weeks. Control: no reconstitution or treatment but HFD for the same time period; PBS: CD4+ T-cell-reconstituted mice treated with PBS or mice reconstituted with PBS-treated CD4+ T cells. *p < 0.05, **p < 0.01, n = 6∼8.
References
-
- Afkarian M, Sedy JR, Yang J, Jacobson NG, Cereb N, Yang SY, Murphy TL, Murphy KM. T-bet is a STAT1-induced regulator of IL-12R expression in naïve CD4+ T cells. Nat Immunol. 2002;3:549–557. - PubMed
-
- Baek KH, Ha SJ, Sung YC. A novel function of phosphorothioate oligodeoxynucleotides as chemoattractants for primary macrophages. J Immunol. 2001;167:2847–2854. - PubMed
-
- Bahceci M, Gokalp D, Bahceci S, Tuzcu A, Atmaca S, Arikan S. The correlation between adiposity and adiponectin, tumor necrosis factor alpha, interleukin-6 and high sensitivity C-reactive protein levels. Is adipocyte size associated with inflammation in adults. J Endocrinol Invest. 2007;30:210–214. - PubMed
Publication types
MeSH terms
Substances
Grants and funding
LinkOut - more resources
Full Text Sources
Medical
Molecular Biology Databases
Research Materials
Miscellaneous
