

Stability of T cell phenotype and functional assays following heparinized umbilical cord blood collection
- PMID: 23027690
- PMCID: PMC4029066
- DOI: 10.1002/cyto.a.22203
Stability of T cell phenotype and functional assays following heparinized umbilical cord blood collection
Abstract
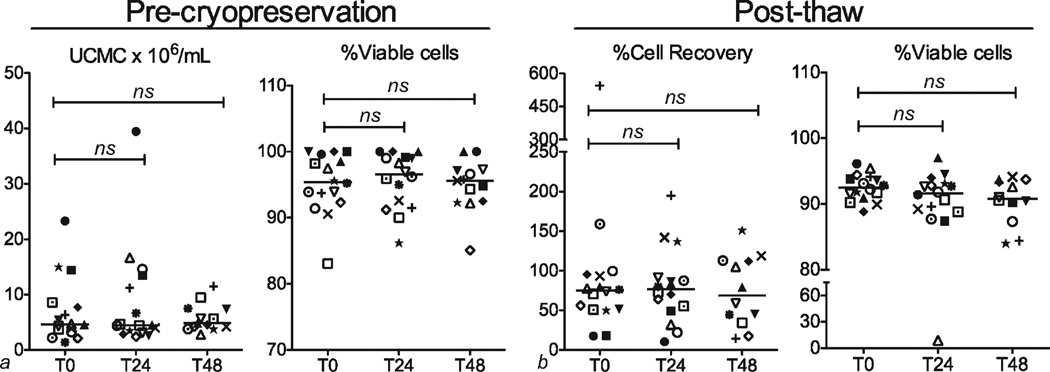
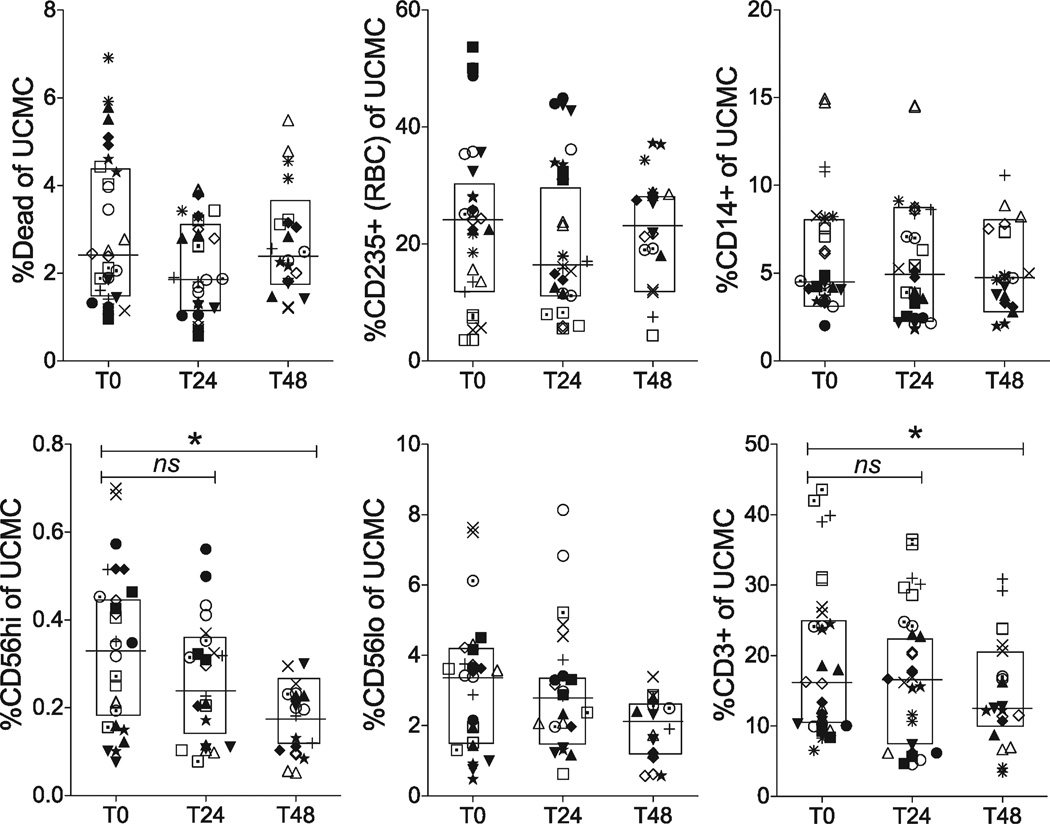
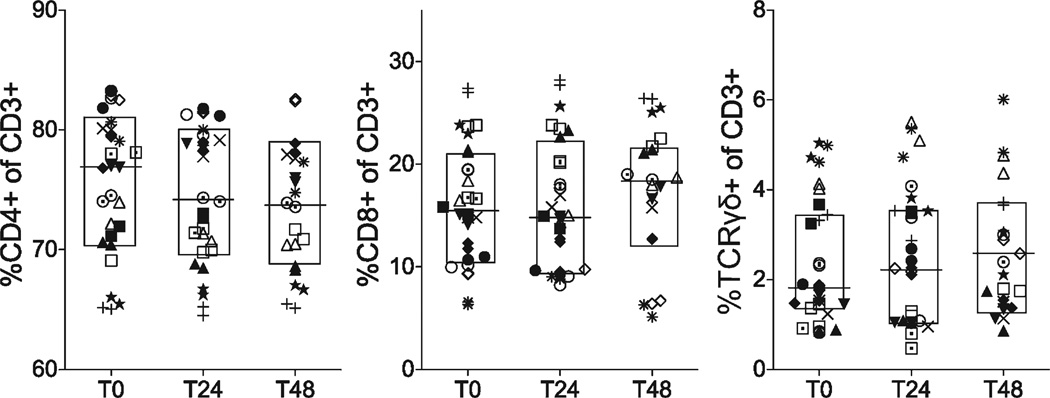
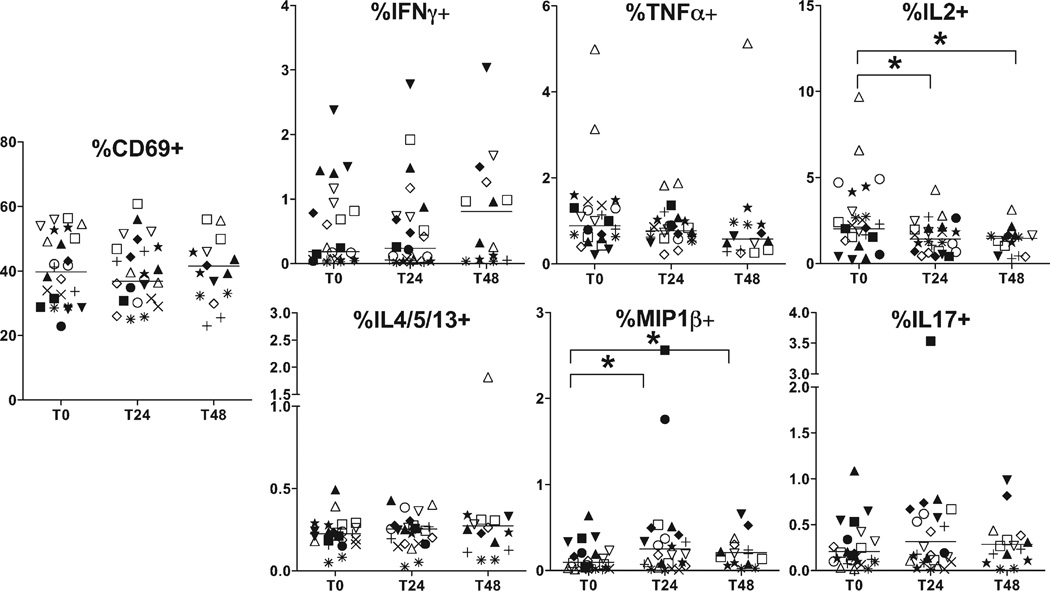
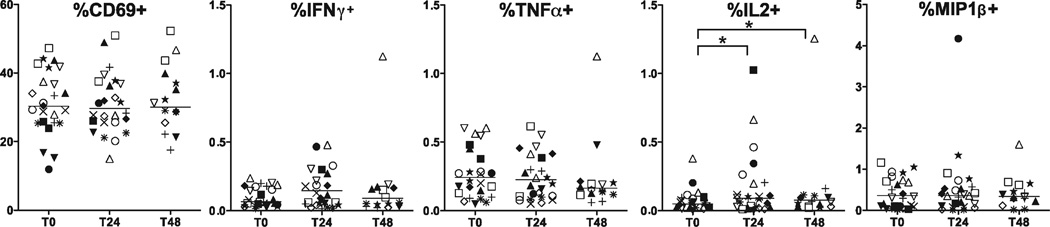
Umbilical cord blood has been used for a wide variety of immunologic investigations including assessments of developmental perturbations by antenatal exposures. Recent advances in multiparameter flow cytometry have allowed finer characterization of lymphocyte phenotype and function, revealing important differences between the fetal and adult immune systems. The degree of variability between human subjects confounds the ability to draw firm conclusions. Artifacts resulting from processing techniques exacerbate this variability. The unpredictable nature of deliveries, especially of premature infants, makes it difficult to control variables such as timing of umbilical cord mononuclear cell (UCMC) isolation and method of collection. Additionally, in multicenter studies dependent on central processing, delays are inevitable. However, little available literature describes systematic testing of the degree to which processing variations affect UCMC phenotype and function. Using multiparameter flow cytometry, we tested the effect of collection technique and length of time prior to UCMC isolation on T cell phenotype and function, with the goal of creating a standardized operating procedure for a multicenter investigation. The study also provides a benchmark data set including extensive surface and functional phenotyping of umbilical cord T cells. UCMC isolation delay of up to 24 h produced similar T cell phenotype and function as tested by in vitro SEB stimulation. There were few statistically significant differences between time points based on data medians. We conclude that, for the purpose of immunologic investigations, a 24-h time delay from sample collection to mononuclear cell isolation does not introduce a significant degree of variation in T cell phenotype and function when adhering to strict standard operating procedures.
Copyright © 2012 International Society for Advancement of Cytometry.
Figures
References
-
- Roederer M. How many events is enough? Are you positive? Cytometry A. 2008;73A:384–385. - PubMed
-
- Duijts L, Bakker-Jonges LE, Labout JA, Jaddoe VW, Hofman A, Steegers EA, van Dongen JJ, Hooijkaas H, Moll HA. Fetal growth influences lymphocyte subset counts at birth: The generation R study. Neonatology. 2009;95:149–156. - PubMed
-
- van Gent R, van Tilburg CM, Nibbelke EE, Otto SA, Gaiser JF, Janssens-Korpela PL, Sanders EA, Borghans JA, Wulffraat NM, Bierings MB, et al. Refined characterization and reference values of the pediatric T- and B-cell compartments. Clin Immunol. 2009;133:95–107. - PubMed
-
- D’Alessio F, Mirabelli P, Gorrese M, Scalia G, Gemei M, Mariotti E, Di Noto R, Martinelli P, Fortunato G, Paladini D, et al. Polychromatic flow cytometry analysis of CD34+ hematopoietic stem cells in cryopreserved early preterm human cord blood samples. Cytometry A. 2011;79A:14–24. - PubMed
Publication types
MeSH terms
Substances
Grants and funding
LinkOut - more resources
Full Text Sources
Other Literature Sources
