. 2012 Dec 1;590(23):6199-212.
doi: 10.1113/jphysiol.2012.242073. Epub 2012 Oct 1.

Quantifying Ca2+ release and inactivation of Ca2+ release in fast- and slow-twitch muscles

Affiliations

Quantifying Ca2+ release and inactivation of Ca2+ release in fast- and slow-twitch muscles

C J Barclay. J Physiol. .

Abstract

The aims of this study were to quantify the Ca(2+) release underlying twitch contractions of mammalian fast- and slow-twitch muscle and to comprehensively describe the transient inactivation of Ca(2+) release following a stimulus. Experiments were performed using bundles of fibres from mouse extensor digitorum longus (EDL) and soleus muscles. Ca(2+) release was quantified from the amount of ATP used to remove Ca(2+) from the myoplasm following stimulation. ATP turnover by crossbridges was blocked pharmacologically (N-benzyl-p-toluenesulphonamide for EDL, blebbistatin for soleus) and muscle heat production was used as an index of Ca(2+) pump ATP turnover. At 20°C, Ca(2+) release in response to a single stimulus was 34 and 84 μmol (kg muscle)(-1) for soleus and EDL, respectively, and increased with temperature (30°C: soleus, 61 μmol kg(-1); EDL, 168 μmol kg(-1)). Delivery of another stimulus within 100 ms of the first produced a smaller Ca(2+) release. The maximum magnitude of the decrease in Ca(2+) release was greater in EDL than soleus. Ca(2+) release recovered with an exponential time course which was faster in EDL (mean time constant at 20°C, 32.1 ms) than soleus (65.6 ms) and faster at 30°C than at 20°C. The amounts of Ca(2+) released and crossbridge cycles performed are consistent with a scheme in which Ca(2+) binding to troponin-C allowed an average of ∼1.7 crossbridge cycles in the two muscles.


Figures
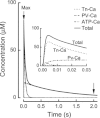
Figure 1
Figure 1. Estimate of Ca2+ remaining in the myoplasm 2 s after stimulus
Time courses of Ca2+ binding to TnC, parvalbumin (PV) and ATP for mouse EDL at 20°C, calculated as described previously (Robertson et al. 1981; Baylor et al. 1983; Gillis, 1985; Brum et al. 1988). Concentrations in the figure are changes from values at rest. Concentrations used for the analysis, expressed relative to muscle volume, are: TnC, 93 μm (Yates & Greaser, 1983); ATP, 5 mm (Kushmerick et al. 1992); PV, 0.44 mm (Heizmann et al. 1982), resting Mg2+, 0.5 mm (Konishi, 1998); resting Ca2+ 0.025 μm. Rate constants for Ca2+ binding are from Baylor & Hollingworth (2003, 2007), scaled to 20°C assuming Q10 values of 2 and adjusted so that concentrations were expressed relative to muscle volume (assuming that muscle volume = 1.9 times cell water volume). The rate constant for dissociation of Ca2+ from PV at 20°C is 1.02 s−1 (frog PV; Hou et al. 1992). Time course of free Ca2+ transient (for clarity, not shown in figure) is taken from Fig. 2 of Baylor & Hollingworth (2003) with amplitude scaled so that the model prediction of the total Ca2+ release (at time indicated by vertical arrow on the left of the figure) matched that measured (Table 1). Total Ca2+ release is the sum of free Ca2+ and Ca2+ bound to TnC, ATP and PV. From ∼0.3 s onwards, total Ca2+ concentration is in effect equal to the concentration of Ca2+ bound to PV. Two seconds after the stimulus (arrow on the right), ∼3.4% or 2.7 μm of the total Ca2+ released remained in the myoplasm bound to PV.
Figure 2
Figure 2. Records of force and heat production with and without inhibition of crossbridge cycling
Records of the time courses of force output (top) and heat output (bottom) in response to a single 1 ms stimulus pulse. Muscle temperature, 20°C. A, records from an EDL preparation (mass, 3.44 mg; length, 8.55 mm) made in the presence (records labelled, ‘+BTS’) and absence (unlabelled records) of the cross-bridge inhibitor BTS are shown. The force record made in the presence of BTS has been lowered by 1 kPa for clarity. B, records from a soleus preparation (mass 4.38 mg, length 13.2 mm) made before and after inhibition of crossbridge cycling using blebbistatin (records labelled, ‘+Blebbistatin’). The force record with blebbistatin present has been lowered by 1 kPa for clarity. The heat produced in the presence of the crossbridge inhibitors is defined as activation heat (QA).
Figure 3
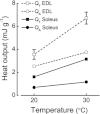
Figure 3. Effects of temperature and muscle type on heat output
The effects of temperature on twitch heat output (QT) and activation heat output (QA) for fibre bundles from mouse soleus and EDL. Lines join mean values (± SEM) for QT or QA at 20°C to the corresponding value at 30°C. Effects of both muscle type and temperature on QT and QA were statistically significant. Values of QT and QA were greater for EDL than soleus (QT, P = 0.001; QA, P < 0.001) and were significantly greater at 30 than 20°C (QT, P < 0.001; QA, P < 0.001).
Figure 4
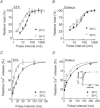
Figure 4. Effect of pulse interval on activation heat output and Ca2+ release in response to the second of two stimuli
A and B, relative activation heat produced by EDL (A) and soleus (B) preparations. Relative activation heat is that produced in response to the second of two stimulus pulses expressed as a percentage of the activation heat produced from the first pulse. Note that the abscissa is drawn with a log10 scale. Pulse interval is defined as the time between the end of the first pulse and the start of the second pulse. The curves are exponentials drawn using the mean parameter values calculated from curves fitted through data from individual muscles. Symbols, mean value; error bars, standard error of the mean. C and D, relative Ca2+ release for EDL (C) and soleus (D), which was calculated from the difference between activation heat and estimated heat from the Na+/K+ pump. The curves are exponentials fitted through the mean data points by least squares regression and the best-fit parameter values are shown in Fig. 5. For clarity, only data for short intervals are shown; the inset to D shows data across a greater interval range for soleus. For both muscles, relative Ca2+ release was ∼100% for intervals ≥500 ms. Symbols, mean values (n = 5 for each muscle at each temperature); error bars, SEM.
Figure 5
Figure 5. Magnitude and rate of reversal of inactivation of Ca2+ release
Column height represents mean values of parameters describing exponential functions fitted through data describing the time course of inactivation of Ca2+ release following a 1 ms conditioning stimulus. Error bars, 1 standard error of the mean (n = 5 for each muscle at each temperature; different preparations used at 20 and 30°C). A, magnitude of inactivation is the degree to which Ca2+ release is inhibited (i.e. 100%, complete inhibition). The magnitude of inactivation for EDL differed significantly from that for soleus (P < 0.001) and differed between 20 and 30°C (P = 0.002). B, time constant for the reversal of inhibition. The time constant was smaller for EDL than for soleus (P < 0.001) and was smaller at 30 than at 20°C (P = 0.017). Analyses performed using two-way ANOVA.
Figure 6
Figure 6. Records of QA output in response to multiple stimulus pulses
A, records of heat produced by an EDL preparation (mass, 5.45 mg; length, 9.98 mm) in the absence of crossbridge cycling in response to 1–5 stimulus pulses delivered at intervals of 50 ms at 20°C. B, effect of temperature on relative heat produced in response to 1–5 stimuli separated by 50 ms. QA is expressed as a percentage of the heat produced in response to one stimulus. Data shown for EDL preparations at 20°C (n = 5) and 30°C (n = 4) and soleus at 20°C (n = 3). Lines fitted by least-squares regression. The slopes (±SE) are: EDL 20°C, 67.8 ± 1.6% per pulse; EDL 30°C, 86.8 ± 3.1% per pulse; soleus 20°C, 63.6 ± 1.9% per pulse. The slopes differ significantly (one-way ANOVA, P = 0.002).

References

    1. Aickin CC, Thomas RC. An investigation of the ionic mechanism of intracellular pH regulation in mouse soleus muscle fibres. J Physiol. 1977;273:295–316. - PMC - PubMed
    1. Barclay CJ. Modelling diffusive O2 supply to isolated preparations of mammalian skeletal and cardiac muscle. J Muscle Res Cell Motil. 2005;26:225–235. - PubMed
    1. Barclay CJ, Arnold PD, Gibbs CL. Fatigue and heat production in repeated contractions of mouse skeletal muscle. J Physiol. 1995;488:741–752. - PMC - PubMed
    1. Barclay CJ, Constable JK, Gibbs CL. Energetics of fast- and slow-twitch muscles of the mouse. J Physiol. 1993a;472:61–80. - PMC - PubMed
    1. Barclay CJ, Curtin NA, Woledge RC. Changes in crossbridge and non-crossbridge energetics during moderate fatigue of frog muscle fibres. J Physiol. 1993b;468:543–556. - PMC - PubMed

Publication types

LinkOut - more resources