. 2012 Oct 23;109(43):E2929-38.
doi: 10.1073/pnas.1207358109. Epub 2012 Oct 1.

Modified SH2 domain to phototrap and identify phosphotyrosine proteins from subcellular sites within cells

Affiliations

Modified SH2 domain to phototrap and identify phosphotyrosine proteins from subcellular sites within cells

Akiyoshi Uezu et al. Proc Natl Acad Sci U S A. .

Abstract

Spatial regulation of tyrosine phosphorylation is important for many aspects of cell biology. However, phosphotyrosine accounts for less than 1% of all phosphorylated substrates, and it is typically a very transient event in vivo. These factors complicate the identification of key tyrosine kinase substrates, especially in the context of their extraordinary spatial organization. Here, we describe an approach to identify tyrosine kinase substrates based on their subcellular distribution from within cells. This method uses an unnatural amino acid-modified Src homology 2 (SH2) domain that is expressed within cells and can covalently trap phosphotyrosine proteins on exposure to light. This SH2 domain-based photoprobe was targeted to cellular structures, such as the actin cytoskeleton, mitochondria, and cellular membranes, to capture tyrosine kinase substrates unique to each cellular region. We demonstrate that RhoA, one of the proteins associated with actin, can be phosphorylated on two tyrosine residues within the switch regions, suggesting that phosphorylation of these residues might modulate RhoA signaling to the actin cytoskeleton. We conclude that expression of SH2 domains within cellular compartments that are capable of covalent phototrapping can reveal the spatial organization of tyrosine kinase substrates that are likely to be important for the regulation of subcellular structures.


Conflict of interest statement

The authors declare no conflict of interest.

Figures
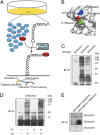
Fig. 1.
Fig. 1.
SH2 domain-based in vivo phototrapping and purification of ligands. (A) Schematic of in vivo phototrapping strategy. A photoactivatable cross-linker, pBpa, is translationally incorporated into the SH2 domain, the site designated by an amber codon, when coexpressed with a pBpa-specific tRNA synthetase and amber suppressor tRNA. pBpa covalently cross-links with a binding protein on UV light exposure. (B) Positions of pBpa relative to the SH2 ligand binding pocket. The surface-rendered SH2 domain structure of c-Abl was used to determine the candidate residues (colored) to be replaced with pBpa. Phosphotyrosine and P + 3 binding pockets are indicated in the figure. (C) Estimation of phototrapping efficacy of three modified SH2 domains. Modified SH2 domains SH2amb1(R175amb), SH2amb2(N177amb), and SH2amb3(S187amb) were expressed in the cell and cultured in media containing pBpa, followed by UV exposure and purification by IgG beads. Precipitants were subjected to immunoblotting (IB) with anti-V5 antibody. (D) Photoactivation and tyrosine-dependent cross linking of SH2 domain. SH2amb2 was expressed in cells and subjected to UV light with or without PV treatment. Immunoblot analysis of purified samples by anti-V5 antibody reveals HMW bands are UV and PV treatment-dependent. (E) EGFR-derived peptides were synthesized onto cellulose membrane and overlaid with the pBpa-modified SH2 domain, followed by UV exposure, and were then immunoblotted with anti-GST antibody.
Fig. 2.
Fig. 2.
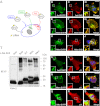
Targeting modified SH2 variants to subcellular compartments. (A) Schematic diagram of strategy to target pBpa-modified SH2 domains to specific subcellular compartments within cells. (BJ) Subcellular targeting sequences (Act, F-actin; Mito, mitochondria; Mem, membrane) fused to the modified SH2 (SH2pBpa) were coexpressed with the targeting sequence fused to a fluorescence protein (EGFP or EYFP) in FreeStyle 293 cells. SH2 expression was detected by anti-V5 immunostaining. Actin-targeted EGFP (Act-EGFP) and Act-SH2 (BD), membrane-targeted (Mem) EYFP and Mem-SH2 (EG), and mitochondria-targeted (Mito) EYFP and Mito-SH2 (HJ) are shown. (Scale bars, 10 μm.) (KS) To verify the presence of phosphotyrosine proteins in each subcellular region, cells expressing targeted fluorescent proteins were immunostained with antiphosphotyrosine antibody. Act-EGFP (KM), Mem-EYFP (NP), and Mito-EYFP (QS) are shown with corresponding images of phosphotyrosine staining. (Scale bars, 10 μm.) (T) Purification of modified SH2 cross-linked protein complexes. Each SH2 variant was purified and subjected to immunoblotting (IB) analysis by anti V5-antibody.
Fig. 3.
Fig. 3.
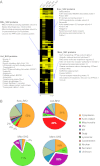
Cluster and gene ontology analysis of targeted SH2 binding proteins. (A) Hierarchical clustering of identified binding proteins for each subcellular targeted SH2 domain. Heavily enriched PI clusters in each SH2 compartment are indicated by blue bars, and selected proteins are shown. (B) Pie graph shows the percentage of proteins classified for different subcellular compartments for each SH2 domain PI cluster. ER, endoplasmic reticulum; PM, plasma membrane.
Fig. 4.
Fig. 4.
Phosphotyrosine binding profile of targeted SH2 binding proteins. (A) Peptide array-based in vitro SH2 binding profile. Peptides surrounding tyrosine sites within H-Ras, which was found in the membrane-targeted SH2 PI cluster, were synthesized on cellulose membrane, followed by incubation with GST-SH2, and were immunoblotted with anti-GST antibody. Relative binding strength was estimated by subtracting the intensity of phosphopeptide from that of nonphosphopeptide and normalized to the control peptide derived from EGFR. The colored bar indicates a previously reported phosphorylation site (19). con., control. (B) Summary of peptide array binding assay. A Venn diagram of each targeted SH2 PI cluster represents the composition of identified phosphotyrosine-dependent peptides and the reported phosphorylated tyrosine sites. (C) Motif analysis of c-Abl SH2 binding sites. OPAL, Oriented Peptide Array Library.
Fig. 5.
Fig. 5.
Phosphotyrosine profile of RhoA. (A) Peptides derived from RhoA were synthesized on cellulose membrane, followed by incubation with GST-SH2, and were immunoblotted with anti-GST antibody. Relative binding strength is shown. Bars represent mean ± SEM (n = 3). (B) Surface representations of the structure of RhoA with switch I and II regions (green and blue, respectively) and five tyrosine sites (red). (C) RhoA is tyrosine-phosphorylated. V5-tagged RhoA was expressed in 293T cells and treated with or without PV. After lysis, RhoA was immunoprecipitated (IP) by V5 antibody and immunoblotted (IB) with antiphosphotyrosine antibody. (D) Candidate screen of potential RhoA tyrosine kinases. V5-tagged WT RhoA or RhoA with all tyrosines substituted to phenylalanine was coexpressed with the indicated kinases in 293T cells. Immunoprecipitated samples were blotted with antiphosphotyrosine antibody. (E) RhoA is tyrosine-phosphorylated in vivo. Endogenous RhoA was immunoprecipitated from 293T cells transfected with or without Bcr-Abl and treated with PV. Precipitates were immunoblotted with anti-RhoA antibody (Upper) or with antiphosphotyrosine antibody (pTy; Lower). (F) RhoA is tyrosine-phosphorylated on tyrosines 34 and 66. Various RhoA mutants were coexpressed with Src or Bcr-Abl and treated with PV, followed by immunoprecipitation with anti-V5 antibody. Precipitates were blotted with antiphosphotyrosine antibody (Upper) or anti-V5 antibody (Lower). (G) Quantitative analysis of tyrosine-phosphorylated RhoA mutants was obtained by densitometry. The amount of phospho-RhoA was normalized to the amount of precipitated RhoA. rel., relative. Bars represent mean ± SEM (n = 3).
Fig. 6.
Fig. 6.
Tyrosines 34 and 66 of RhoA are crucial for effector binding in cells. (A) Schematic of the RhoA activity FRET sensor. mEGFP was tagged to the N terminus of RhoA, and mCherry was attached to the N and C termini of the RBD of Rhotekin (8–89 amino acids). When RhoA is activated, RBD binds to RhoA, producing FRET between mEGFP and mCherry. (B) (Left) Representative fluorescence lifetime images in HeLa cells. Cells were transfected with dominant active RhoA (RhoAQ63L), dominant active phosphomimic mutant with both tyrosines 34 and 66 substituted to glutamic acid [RhoAQ63L(Y34,66E)], and WT RhoA (RhoAwt). Warmer colors indicate shorter lifetimes and higher levels of RhoA activity. (Right) Relative binding fraction of RhoA mutants. Bars represent mean ± SEM (n ≥ 10). ***P < 0.001. (C) (Left) Representative fluorescence lifetime images in HeLa cells of RhoAQ63L coexpressing SrcDN or SrcCA. (Right) Relative binding fractions of RhoAQ63L. Bars represent mean ± SEM (n ≥ 50) from three independent experiments. **P < 0.01. (D) Fluorescence lifetime images of RhoA activation induced by EGF. WT, phosphomimic mutant (Y34,66E), or dominant negative (T17N) RhoA was expressed in HeLa cells and stimulated with 20 nM EGF, and activity was measured by 2pFLIM. (E) Graph depicts the time course of RhoA activation indicated by the change in the fraction of RhoA bound to the sensor. Bars represent mean ± SEM. (Scale bars, 50 μm.)
Fig. 7.
Fig. 7.
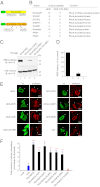
Y34,66E of RhoA abolishes effector binding and stress fiber formation. (A) Schematic figures depict RhoA mutants used to identify endogenous GAPs or effectors. Constitutively active RhoA (RhoAQ63L) and its phosphomimic (Y34,66E) mutant were tagged with GFP and expressed in 293T cells, followed by immunoprecipitation. Precipitated samples were subjected to MS analyses. (B) Identified proteins in each sample. Actin cytoskeleton-related proteins identified in constitutively active RhoA (Q63L) or RhoAQ63L phosphomimic mutant are shown with the number of uniquely identified peptides in each protein. (C) Representative Western blot of Rhotekin RBD pull-down assays from cells expressing RhoAQ63L or individual phosphomimic mutants (indicated above). IB, immunoblotting. (Upper) Amounts of each RhoA mutant precipitated by the RBD pull-down are shown. (Lower) Equal levels of expression of each mutant in the lysates are shown. (D) Graph depicts the quantification of the RBD pull-downs as shown in C. Bars represent mean ± SEM (n = 3). (E) Induction of F-actin stress fiber formation by RhoA mutants. V5-tagged WT RhoA (wild), constitutive active RhoAQ63L (Q63L), phosphomimic forms of RhoAQ63L (34E, 66E, or 34,66E), or controls (34F, 66F, or 34,66F) were expressed in HeLa cells, followed by immunostaining with anti-V5 antibody and phalloidin and DAPI labeling. (Scale bars, 10 μm.) (F) Quantitative analysis of RhoA-induced F-actin stress fiber formation. The average fluorescence intensity of F-actin in each V5-RhoA mutant–expressing cell was measured. The fold induction of cellular stress fiber formation was calculated, normalized to RhoA. Bars represent mean ± SEM from three independent experiments (n ≥ 30). ***P < 0.001; **P < 0.01 in blue are mutants compared with RhoA. +++P < 0.0001; ++P < 0.01 in red are mutants compared with RhoAQ63L(Y34,66E).
Fig. P1.
Fig. P1.
SH2-based phototrapping of phosphotyrosine proteins at distinct subcellular sites in cells. For understanding phosphorylated substrates at a global scale (conventional approach), cells or tissues are lysed and subfractionated to purify subcellular sites of interest. After the organelles or structures are isolated, the proteins are digested, the phosphopeptides are enriched, and the phosphoproteins or phosphorylation sites are identified by liquid chromatography (LC)-MS/MS combined with data analysis. Here, we describe an SH2-based approach that uses an unnatural photo cross-linking phenylalanine analog, called pBpa, that is incorporated into this domain and targeted to distinct subcellular sites to trap phosphotyrosine proteins from within cells. Captured proteins are tandem affinity purification tag (TAP)-purified and identified by MS analysis to reveal proteins existing at each subcellular site. Act, actin-targeted; Mem, membrane-targeted; Mito, mitochondria-targeted.

References

    1. Schirmer EC, Florens L, Guan T, Yates JR, 3rd, Gerace L. Nuclear membrane proteins with potential disease links found by subtractive proteomics. Science. 2003;301:1380–1382. - PubMed
    1. Foster LJ, et al. A mammalian organelle map by protein correlation profiling. Cell. 2006;125:187–199. - PubMed
    1. Blume-Jensen P, Hunter T. Oncogenic kinase signalling. Nature. 2001;411:355–365. - PubMed
    1. Rikova K, et al. Global survey of phosphotyrosine signaling identifies oncogenic kinases in lung cancer. Cell. 2007;131:1190–1203. - PubMed
    1. Villén J, Beausoleil SA, Gerber SA, Gygi SP. Large-scale phosphorylation analysis of mouse liver. Proc Natl Acad Sci USA. 2007;104:1488–1493. - PMC - PubMed

Publication types