. 2012 Oct 16;109(42):E2846-55.
doi: 10.1073/pnas.1207574109. Epub 2012 Oct 1.

Correlating microbial community profiles with geochemical data in highly stratified sediments from the Arctic Mid-Ocean Ridge

Affiliations

Correlating microbial community profiles with geochemical data in highly stratified sediments from the Arctic Mid-Ocean Ridge

Steffen Leth Jorgensen et al. Proc Natl Acad Sci U S A. .

Abstract

Microbial communities and their associated metabolic activity in marine sediments have a profound impact on global biogeochemical cycles. Their composition and structure are attributed to geochemical and physical factors, but finding direct correlations has remained a challenge. Here we show a significant statistical relationship between variation in geochemical composition and prokaryotic community structure within deep-sea sediments. We obtained comprehensive geochemical data from two gravity cores near the hydrothermal vent field Loki's Castle at the Arctic Mid-Ocean Ridge, in the Norwegian-Greenland Sea. Geochemical properties in the rift valley sediments exhibited strong centimeter-scale stratigraphic variability. Microbial populations were profiled by pyrosequencing from 15 sediment horizons (59,364 16S rRNA gene tags), quantitatively assessed by qPCR, and phylogenetically analyzed. Although the same taxa were generally present in all samples, their relative abundances varied substantially among horizons and fluctuated between Bacteria- and Archaea-dominated communities. By independently summarizing covariance structures of the relative abundance data and geochemical data, using principal components analysis, we found a significant correlation between changes in geochemical composition and changes in community structure. Differences in organic carbon and mineralogy shaped the relative abundance of microbial taxa. We used correlations to build hypotheses about energy metabolisms, particularly of the Deep Sea Archaeal Group, specific Deltaproteobacteria, and sediment lineages of potentially anaerobic Marine Group I Archaea. We demonstrate that total prokaryotic community structure can be directly correlated to geochemistry within these sediments, thus enhancing our understanding of biogeochemical cycling and our ability to predict metabolisms of uncultured microbes in deep-sea sediments.


Conflict of interest statement

The authors declare no conflict of interest.

Figures

Fig. 1.
Fig. 1.
Characteristics of gravity cores GC6 (A) and GC12 (B) including geochemical data and relative abundances of the four most dominant bacterial and archaeal taxa/phyla. (Left to Right) Photograph of the archive half core; XRF core scanner maps of normalized iron and manganese content; pore water concentrations of ammonium, nitrate, manganese, iron and sulfate; organic carbon content in the sediment (weight %); total number of 16S rRNA gene copies/g sediment (wet weight) as measured by qPCR; percent of total SSU reads obtained from the given taxa in the amplicon library in each horizon. Note that different scales on the x-axis are color coded to indicate the different respiration processes, based on pore water geochemistry: blue, aerobic oxidation; red, nitrate reduction; purple, manganese reduction; brown, iron reduction; green, sulfate reduction. Delta, Deltaproteobacteria; Epsilon, Epsilonproteobacteria; P.mycetes, Planctomycetes; Thermoplas, Thermoplasmata.
Fig. 2.
Fig. 2.
Significant correlations (α = 0.05) between variation in microbial community structure and context data. Microbial community variation is measured by PC1 scores on relative abundance data at the class level. (A) Organic carbon content (% C). (B) Pore water sulfate concentration (mM). (C) Relative iron content in solid-phase Iron values as measured by counts by XRF and normalized to Ti counts. (D) Relative content of manganese measured in the solid phase. Manganese values are measured as counts by XRF and normalized to titanium (Ti) counts. Correlations are given as Spearman’s rank-order correlation (ρ). Blue circles indicate values from gravity core GC6; red triangles indicate values from gravity core GC12. Color shading indicates depth in sediment (light, shallow; dark, deep).
Fig. 3.
Fig. 3.
Phylogenetic analysis and depth distribution of MG-I. (A) Phylogeny based on SSU rRNA gene information from all published sequences available in the Silva database (release 104). The nomenclature follows that used by Durbin and Teske (50), but the additional group names lambda I, lambda II, and mu are given. The tree is reconstructed by NJ using the Felsenstein correction. Topology and clusters are supported by RaxML and PhyML reconstructions on the same dataset. Clusters marked with an asterisk contain sequences retrieved from marine hydrothermal environments. The sediment cluster marked with ^ contains a subcluster of freshwater/terrestrial sequences. Numbers in parentheses indicate the total number of reads from our study that affiliated with that particular group. (B and C) Depth distribution of MG-1 16S rRNA gene sequences affiliating with each cluster obtained in this study from core GC6 (B) and core GC12 (C). Numbers in parentheses indicate the number of reads from that horizon assigned to MG-1 and the percentage of the total. Color codes correspond to the groups in A.
Fig. 4.
Fig. 4.
Covariance between relative abundance of MG-I and context data. The depth distribution of the relative abundance of MG-I in core GC6 strongly covaries with (A) nitrate concentration (ppm) extracted from the solid phase (Pearson’s r = 0.827, P = 0.011); (B) archaeal SSU rDNA (r = 0.827, P = 0.011); and (C) archaeal amoA gene copies (r = 0.929, P < 0.000). Gene copy numbers are estimated by qPCR and given per gram of sediment (wet weight). See also Fig. S3.
Fig. 5.
Fig. 5.
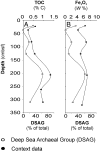
Covariance between relative abundance of DSAG and context data. The depth distribution of the relative abundance of DSAG in core GC12 strongly covaries with (A) TOC (Pearson’s r = 0.869, P = 0.025) and (B) Fe2O3 concentrations in the sediment (Pearson’s r = 0.819, P = 0.046). See also Fig. S3.
Fig. P1.
Fig. P1.
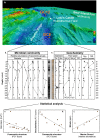
Correlating microbial community profiles with geochemical data in highly stratified deep-sea sediments. (A) Bathymetric map of the rift valley along the spreading ridge in the Norwegian-Greenland Sea showing the location of the two gravity cores, GC6 and GC12. (B) Selected sediment horizons were sampled and analyzed for microbial community composition. The relative abundance of the four most dominant bacteria and archaea in GC6 is shown along with an X-ray image of the sediment core. Relative abundance values are normalized for visual purposes. Roman numerals I–VIII correspond to the following taxa: Chloroflexi, Planctomycetes, Japanese Division 1, Deltaproteobacteria, Marine Group 1, Deep Sea Archaeal Group, Miscellaneous Crenarchaeotic Group, and Thermoplasmata, respectively. (C) We analyzed each sample to determine multiple geochemical and physical parameters. Some of the more important parameters are shown here, along with a photograph of core GC6. (D) Independent multivariate analysis of the microbial and geochemical data uncovered correlations between the covariance structures in the two datasets across both cores. Values are scores along the first principal component (PC1). (E) Overall variation in microbial community structure correlated with individual geochemical parameters across both cores. (F) Relative abundance of individual taxa was linked to specific geochemical parameters within cores.

Comment in

References

    1. Whitman WB, Coleman DC, Wiebe WJ. Prokaryotes: The unseen majority. Proc Natl Acad Sci USA. 1998;95:6578–6583. - PMC - PubMed
    1. Parkes RJ, Cragg BA, Wellsbury P. Recent studies on bacterial populations and processes in subseafloor sediments: A review. Hydrogeol J. 2000;8(1):11–28.
    1. Berner RA. Burial of organic carbon and pyrite sulfur in the modern ocean; its geochemical and environmental significance. Am J Sci. 1982;282(4):451–473.
    1. Rochelle PA, Fry JC, Parkes RJ, Weightman AJ. DNA extraction for 16S ribosomal-RNA gene analysis to determine genetic diversity in deep sediment communities. FEMS Microbiol Lett. 1992;100(1–3):59–65. - PubMed
    1. Marchesi JR, Weightman AJ, Cragg BA, Parkes RJ, Fry JC. Methanogen and bacterial diversity and distribution in deep gas hydrate sediments from the Cascadia Margin as revealed by 16S rRNA molecular analysis. FEMS Microbiol Ecol. 2001;34(3):221–228. - PubMed

Publication types

LinkOut - more resources