. 2012 Oct 1;26(19):2169-79.
doi: 10.1101/gad.189126.112.

Promoter-proximal polyadenylation sites reduce transcription activity

Affiliations

Promoter-proximal polyadenylation sites reduce transcription activity

Pia K Andersen et al. Genes Dev. .

Abstract

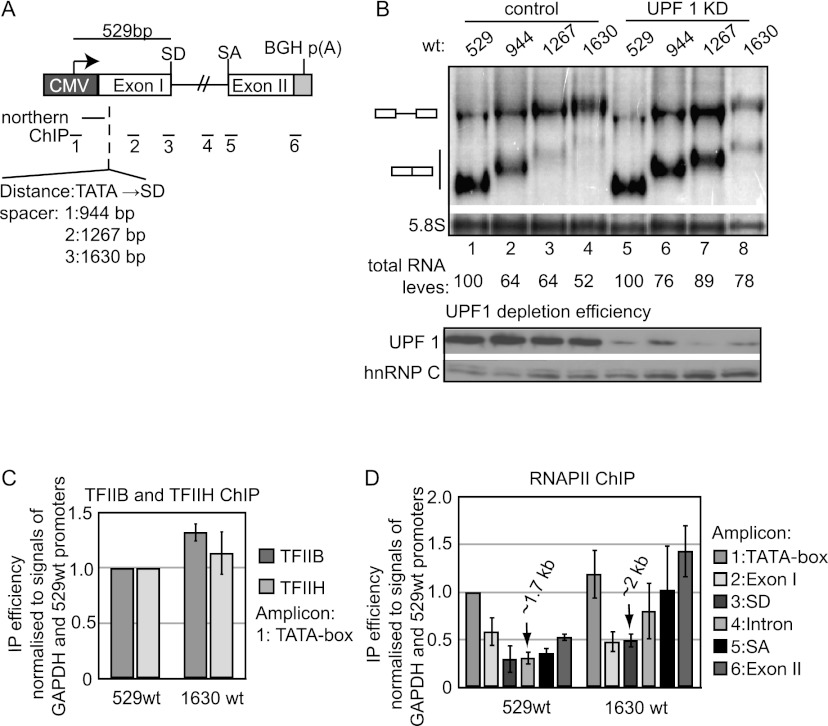
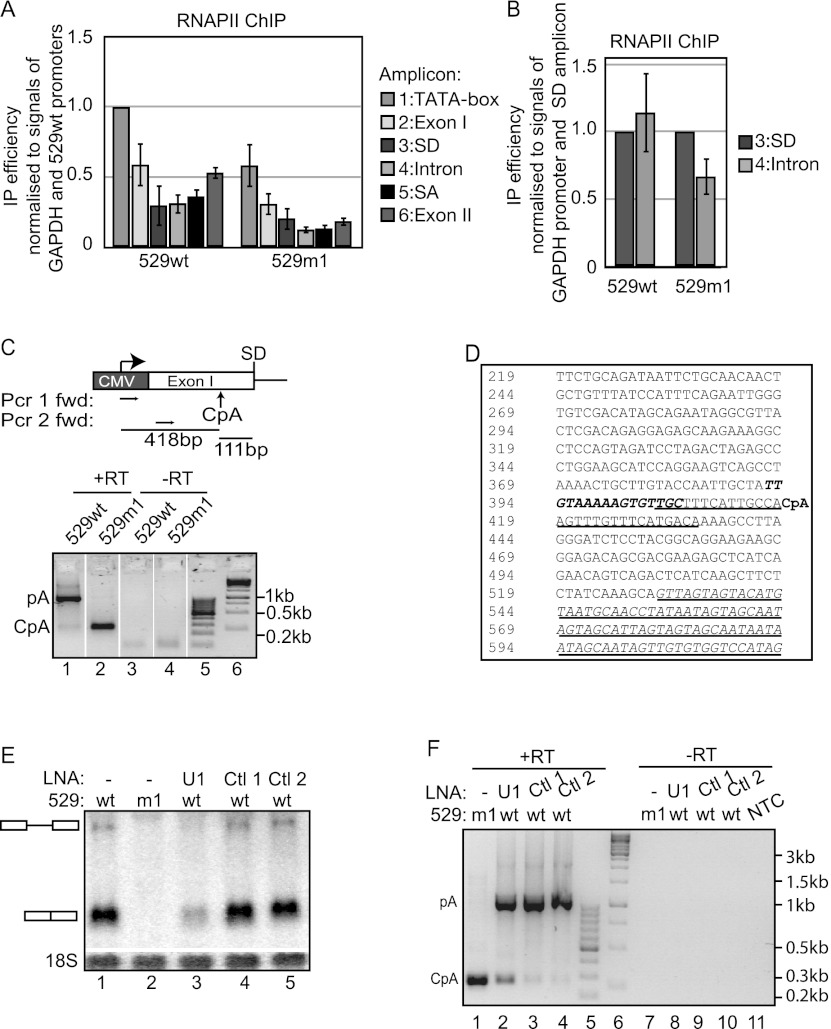
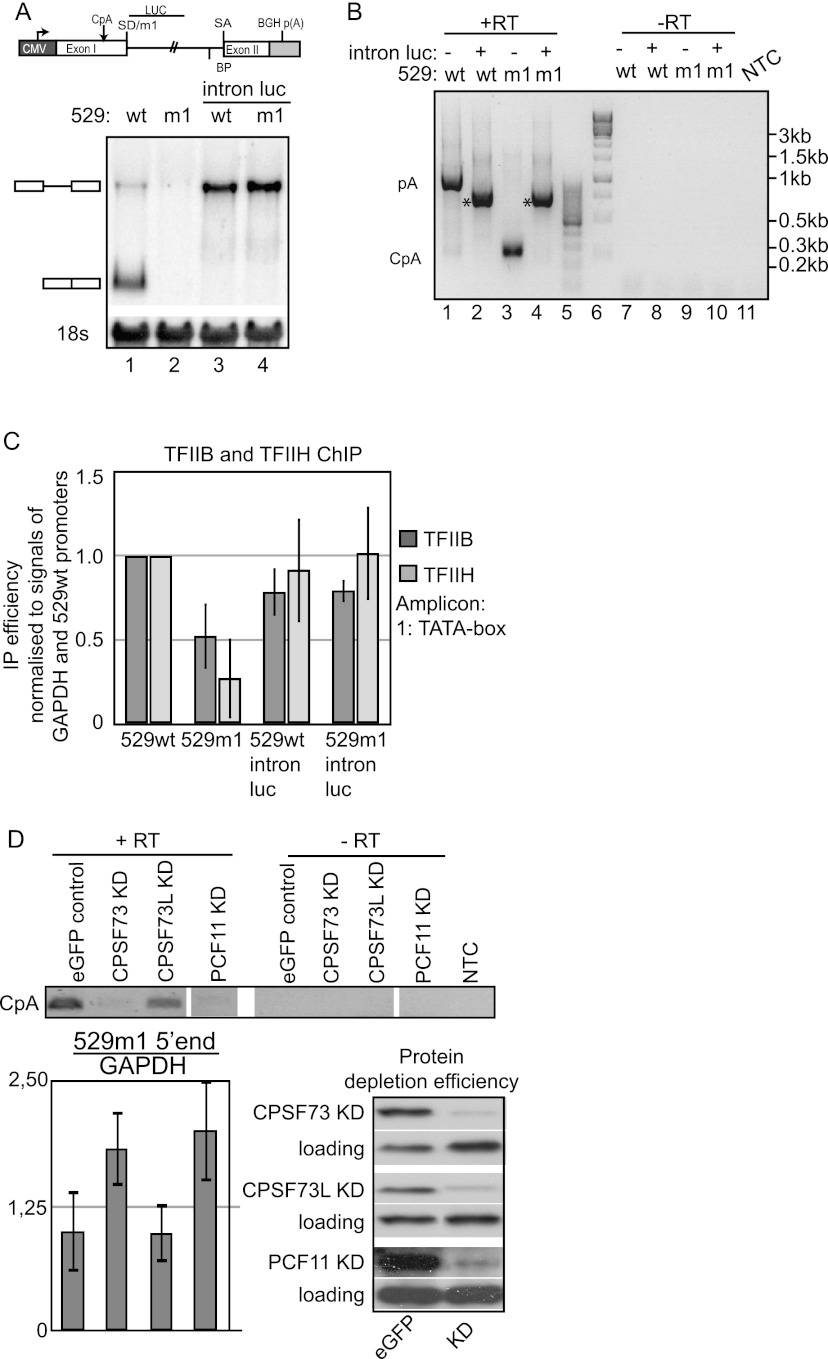
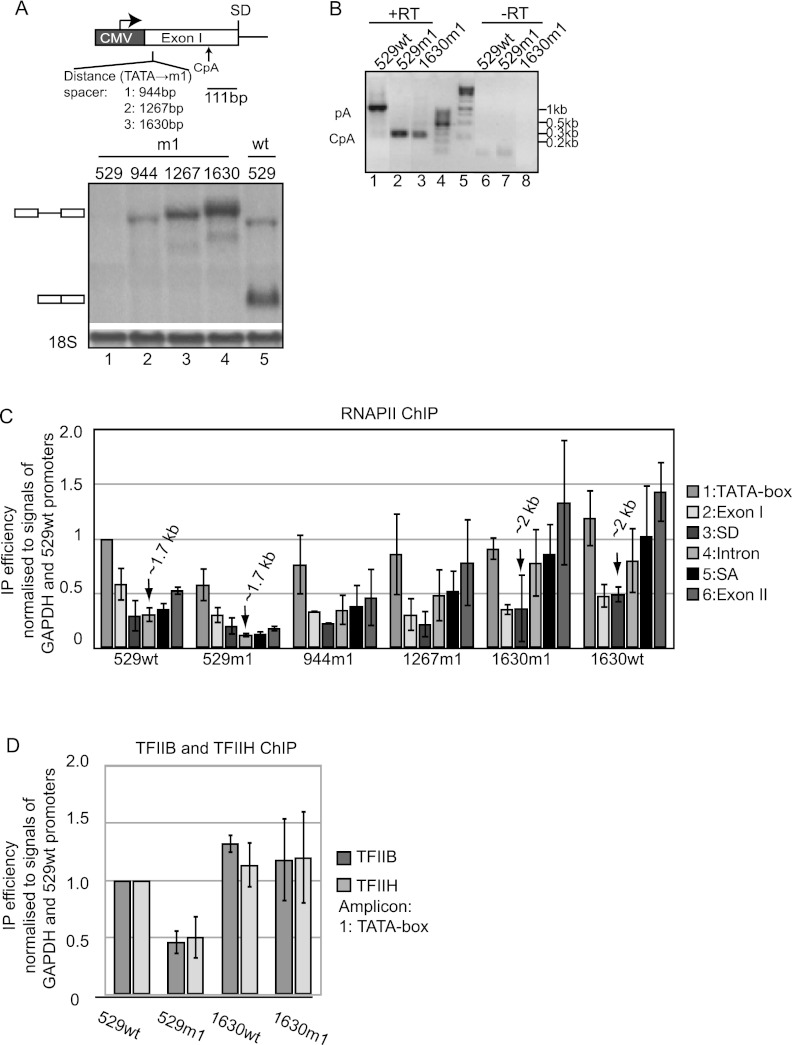
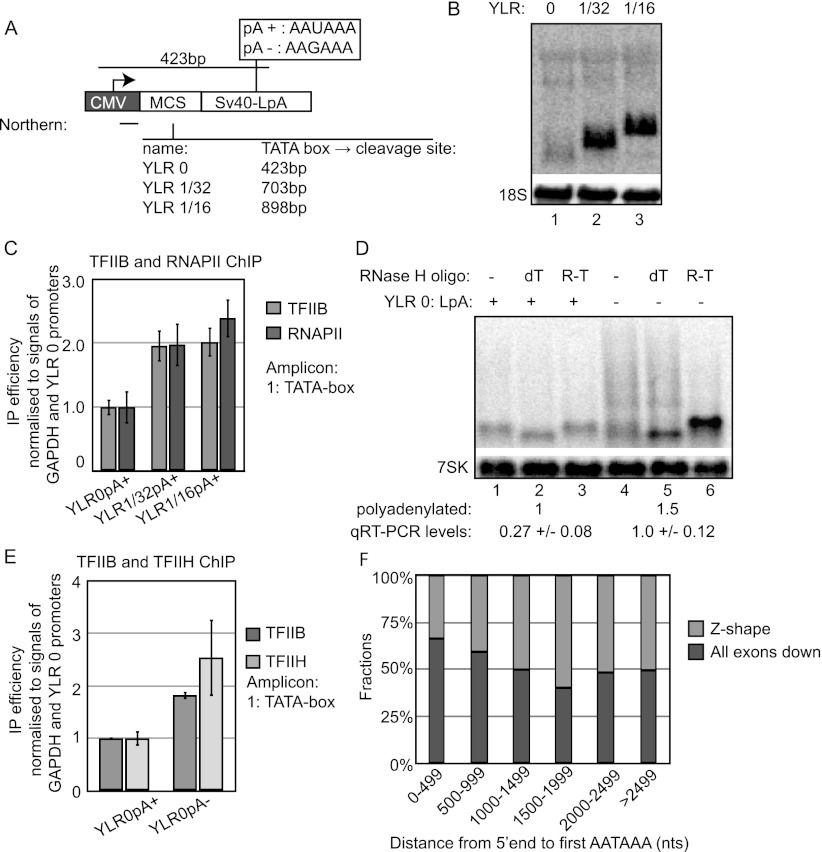
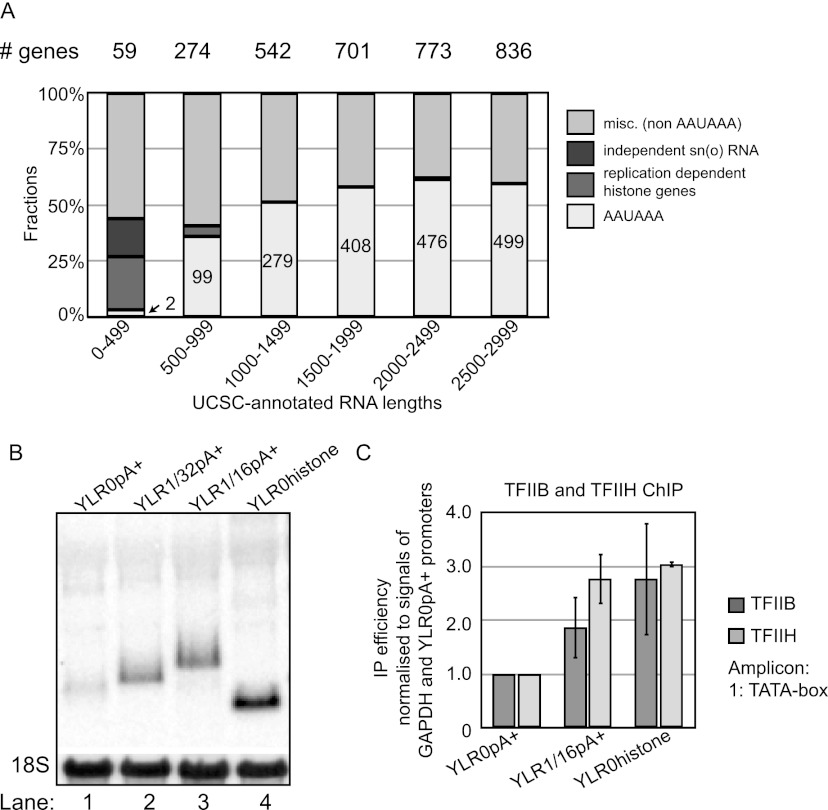
Gene expression relies on the functional communication between mRNA processing and transcription. We previously described the negative impact of a point-mutated splice donor (SD) site on transcription. Here we demonstrate that this mutation activates an upstream cryptic polyadenylation (CpA) site, which in turn causes reduced transcription. Functional depletion of U1 snRNP in the context of the wild-type SD triggers the same CpA event accompanied by decreased RNA levels. Thus, in accordance with recent findings, U1 snRNP can shield premature pA sites. The negative impact of unshielded pA sites on transcription requires promoter proximity, as demonstrated using artificial constructs and supported by a genome-wide data set. Importantly, transcription down-regulation can be recapitulated in a gene context devoid of splice sites by placing a functional bona fide pA site/transcription terminator within ~500 base pairs of the promoter. In contrast, promoter-proximal positioning of a pA site-independent histone gene terminator supports high transcription levels. We propose that optimal communication between a pA site-dependent gene terminator and its promoter critically depends on gene length and that short RNA polymerase II-transcribed genes use specialized termination mechanisms to maintain high transcription levels.


Figures

Figure 1.
Figure 1.
HIV1 gene transcription activity is unaffected by promoter–SD distance. (A) Schematic representation of exon/intron structure of the assayed HIV1-ENV gene. The insertion site of spacer DNA, together with positions of Northern probes and ChIP amplicons, is shown. (B) Northern blotting analysis of total RNA harvested from the indicated cell lines after 24 h of Tet induction and treated with either control (eGFP) (lanes 1–4) or UPF1 (lanes 5–8) siRNAs. Note the underloading of lane 8. Migration of spliced and unspliced HIV-1 RNA is indicated to the left of the gel. Quantification of total HIV-1 RNA (spliced plus unspliced) normalized to levels of the 5.8S rRNA loading control is shown below the gel. Total RNA levels of 529wt were set to 100% in control and UPF1 KD samples, respectively. Depletion of UPF1 was verified by Western blotting analysis using anti-UPF1 antibody. hnRNP C was used as a loading control. (C) TFIIB and TFIIH CMV promoter ChIP analysis of cells subjected to 24 h of Tet induction. ChIP values were background-subtracted (no antibody control) and normalized to GAPDH promoter signals from the same samples. Signals from the 529wt promoter region were set to 1. Histograms represent averages of three independent biological experiments, each with three qPCR replicates. Standard deviations are shown. (D) RNAPII occupancy throughout the indicated loci measured by RPB1 ChIP using amplicons depicted in A and analyzed and displayed as in C. Numbered arrows denote the distance from the start of the CMV TATA box to the 3′ end of the reverse primer of the respective amplicon.
Figure 2.
Figure 2.
U1 snRNP/SD interaction suppresses a CpA site upstream of the HIV-1 ENV exon/intron border. (A) RNAPII ChIP analysis of 529wt and 529m1 cells subjected to 24 h of Tet induction using ChIP amplicons depicted in Figure 1A and analyzed and displayed as in Figure 1D. (B) RNAPII SD and Intron amplicon signals from A plotted with SD signal set to 1 for both 529wt and 529m1 genes. (C, top) Schematic drawing of the positions of 3′ RACE forward primers and the mapped CpA site in relation to the CMV promoter and the exon/intron border. (Bottom) 3′ RACE seminested RT–PCR of total RNA harvested from 18-h Tet-induced 529wt or 529m1 cells as indicated. “+RT” and “−RT” denote the addition or omission of reverse transcriptase, respectively. The sizes of DNA markers run in lanes 5 and 6 are indicated at the right. (D) Sequence of the DNA region surrounding the mapped CpA site (denoted by bold “CpA”). The intron sequence is underlined, bold italic letters denote a deleted upstream region in 529wt/m1Δ−27– −12, and a plain underlined sequence around the CpA site denotes the deleted sequence of 529wt/m1ΔCpA. Numbering annotates the distance in base pairs to the first T of the TATA box. (E) Northern blotting analysis of HIV-1 RNA harvested from 12-h Tet-induced 529wt or 529m1 cells treated with either “anti-U1” or control LNA/DNA hybrids. The Ctl1 and Ctl2 sequences were directed toward the antisense strand of eGFP and the yeast SSA4 RNA, respectively. Migration of spliced and unspliced HIV1 RNA is indicated at the left of the gel. 18S rRNA was used as a loading control. (F) 3′ RACE seminested RT–PCR on RNA samples from E analyzed and displayed as in C. (NTC) No template control.
Figure 3.
Figure 3.
Inhibition of CpA usage causes transcription derepression. (A, top) Schematic drawing of HIV1-ENV constructs, indicating the part of the intron exchanged by luciferase sequence to create 529wt-intronLuc and 529m1-intronLuc. SD/m1, splice acceptor (SA), and branch point (BP) sequences were all left intact. (Bottom) Northern blotting analysis of total RNA harvested from 529wt-intronLuc and 529m1-intronLuc cells after 24 h of Tet induction. The loading control and gel annotation are as in Figure 2E. (B) 3′ RACE seminested RT–PCR on RNA samples from A analyzed and displayed as in Figure 2C. Asterisks indicate an RT–PCR product arising from internal dT priming of a short stretch of As in the luciferase insertion. (C) TFIIB and TFIIH CMV promoter ChIP analyses of cells from A analyzed and displayed as in Figure 1C. (D) Semiquantitative 3′ RACE of 529m1 RNA harvested from cells treated with siRNA against eGFP, CPSF73, CPSF73L, or PCF11 as indicated. First and second PCRs contained 15 and 35 cycles, respectively. RT-qPCR levels of the extreme 5′ end of 529m1 RNA are shown relative to GAPDH RT-qPCR levels of the same samples. Standard deviations were calculated from three independent qPCR reactions. Protein depletions were verified by Western blotting analysis using the indicated antibodies. Loading was controlled by the display of cross-reacting protein species.
Figure 4.
Figure 4.
Promoter-proximal CpA utilization down-regulates transcription. (A, top) Schematic drawing showing the spacer insertion site relative to the CpA position. (Bottom) Northern blotting analysis of total RNA harvested from indicated cells Tet-induced for 24 h. The loading control and gel annotation are as in Figure 2E. (B) 3′ RACE seminested RT–PCR on total RNA samples from the 529wt, 529m1, and 1630m1 cell lines from A analyzed and displayed as in Figure 2C. Sizes estimated from DNA markers in lanes 4 and 5 are indicated at the right. (C) RNAPII ChIP analysis of the indicated loci using conditions and amplicons as in Figure 1D. Data were analyzed and displayed as in Figure 1D. (D) TFIIB and TFIIH CMV promoter ChIP analysis of indicated loci analyzed and displayed as in Figure 1C.
Figure 5.
Figure 5.
A functional promoter-proximal SV40-LpA site negatively affects transcription. (A) Schematic overview of the “YLR constructs.” YLR0 contains a multiple cloning site (MCS) sequence, while the fractions in YLR1/32 and YLR1/16 indicate which portions (from the 5′ end) of the YLR454W gene were inserted. All constructs harbor either a wild-type (wt) (pA+) or a point-mutated (pA) SV40-LpA site as indicated in the box. The horizontal black line below “CMV” denotes the position of the radiolabeled probe used for Northern blotting analysis. Distances from the CMV TATA box to the SV40-LpA cleavage site of the various constructs are indicated. (B) Northern blotting analysis of total RNA harvested from the indicated cells Tet-induced for 24 h. The loading control is as in Figure 2E. (C) TFIIB and RNAPII CMV promoter ChIP analysis of the indicated loci analyzed and displayed as in Figure 1C. (D) RNase H/Northern blotting analysis of RNA harvested from the indicated cells Tet-induced for 24 h. Total RNA was treated with RNase H and DNA oligonucleotides directed against either the pA tail (“dT”) or the readthough region (“R-T”) immediately downstream from the SV40-LpA site. Numbers below the gel show quantification of transcripts polyadenylated at the SV40-LpA site as well as total transcript levels as measured by qRT–PCR using an mRNA-specific reverse transcription reaction followed by PCR of the YLR 5′ end and normalized to endogenous GAPDH levels. Standard deviations are based on qPCR triplicates. (E) TFIIB and TFIIH CMV promoter ChIP analysis of the indicated loci analyzed and displayed as in Figure 1C. (F) Fractions of the “all exons down” (dark gray) and “Z-shaped” (light gray) distributions (as previously defined by Berg et al. 2012) as a function of the distance between the 5′ end and the first AAUAAA hexamer in transcripts.
Figure 6.
Figure 6.
Short human genes acquire pA site-independent terminators for their optimal expression. (A) Fraction of human genes harboring different transcription terminators plotted as a function of the predicted lengths of their produced RNAs. Annotated genes from the UCSC Genome Browser (http://genome.ucsc.edu) hg18 assembly were analyzed as follows: Genes with no ORF and without either a 5′ UTR or a 3′ UTR were discarded. Remaining examples were divided based on the estimated length of their produced RNA as indicated in the histogram. “AAUAAA” denotes RNAs with this consensus sequence in the 3′ UTR, and the actual number of genes with AAUAAA in the 3′ UTR is annotated in the respective bar. “Replication dependent histone genes” were taken from Marzluff et al. (2002). Furthermore, independently transcribed and capped sn(o)RNAs (U1, U2, U3, U4, U5, U8, U13, U11, U12, and U4atac) were included. “Misc. (non-AAUAAA)”denotes annotated genes that did not fall into the above-mentioned groups. The number of genes in each size category is indicated above the histogram, and the total fraction is set to 100%. (B) Northern blotting analysis of total RNA harvested from the indicated cells Tet-induced for 24 h. The loading control is as in Figure 2E. (C) TFIIB and TFIIH occupancies at the promoters of the indicated gene constructs analyzed and displayed as in Figure 1C.

References

    1. Ashe MP, Griffin P, James W, Proudfoot NJ 1995. Poly(A) site selection in the HIV-1 provirus: Inhibition of promoter-proximal polyadenylation by the downstream major splice donor site. Genes Dev 9: 3008–3025 - PubMed
    1. Ashe MP, Pearson LH, Proudfoot NJ 1997. The HIV-1 5′ LTR poly(A) site is inactivated by U1 snRNP interaction with the downstream major splice donor site. EMBO J 16: 5752–5763 - PMC - PubMed
    1. Baillat D, Hakimi MA, Näär AM, Shilatifard A, Cooch N, Shiekhattar R 2005. Integrator, a multiprotein mediator of small nuclear RNA processing, associates with the C-terminal repreat of RNA polymerase II. Cell 123: 265–276 - PubMed
    1. Beaudoing E, Freier S, Wyatt JR, Claverie JM, Gautheret D 2000. Patterns of variant polyadenylation signal usage in human genes. Genome Res 10: 1001–1010 - PMC - PubMed
    1. Berg MG, Singh LN, Younis I, Liu Q, Pinto AM, Kaida D, Zang Z, Cho S, Sherrill-Mix M, Wan L, et al. 2012. U1 snRNP determines mRNA length and regulates isoform expression. Cell 150: 53–64 - PMC - PubMed

Publication types

Substances

LinkOut - more resources