

Inferring the structure of social contacts from demographic data in the analysis of infectious diseases spread
- PMID: 23028275
- PMCID: PMC3441445
- DOI: 10.1371/journal.pcbi.1002673
Inferring the structure of social contacts from demographic data in the analysis of infectious diseases spread
Abstract
Social contact patterns among individuals encode the transmission route of infectious diseases and are a key ingredient in the realistic characterization and modeling of epidemics. Unfortunately, the gathering of high quality experimental data on contact patterns in human populations is a very difficult task even at the coarse level of mixing patterns among age groups. Here we propose an alternative route to the estimation of mixing patterns that relies on the construction of virtual populations parametrized with highly detailed census and demographic data. We present the modeling of the population of 26 European countries and the generation of the corresponding synthetic contact matrices among the population age groups. The method is validated by a detailed comparison with the matrices obtained in six European countries by the most extensive survey study on mixing patterns. The methodology presented here allows a large scale comparison of mixing patterns in Europe, highlighting general common features as well as country-specific differences. We find clear relations between epidemiologically relevant quantities (reproduction number and attack rate) and socio-demographic characteristics of the populations, such as the average age of the population and the duration of primary school cycle. This study provides a numerical approach for the generation of human mixing patterns that can be used to improve the accuracy of mathematical models in the absence of specific experimental data.
Conflict of interest statement
The authors have declared that no competing interests exist.
Figures
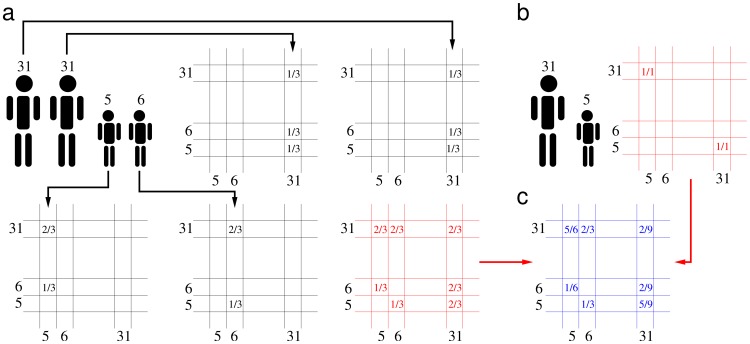
 have with individuals aged
  is given by the sum of the contributions from each household, divided by the number of individuals aged
  having at least one household contact.
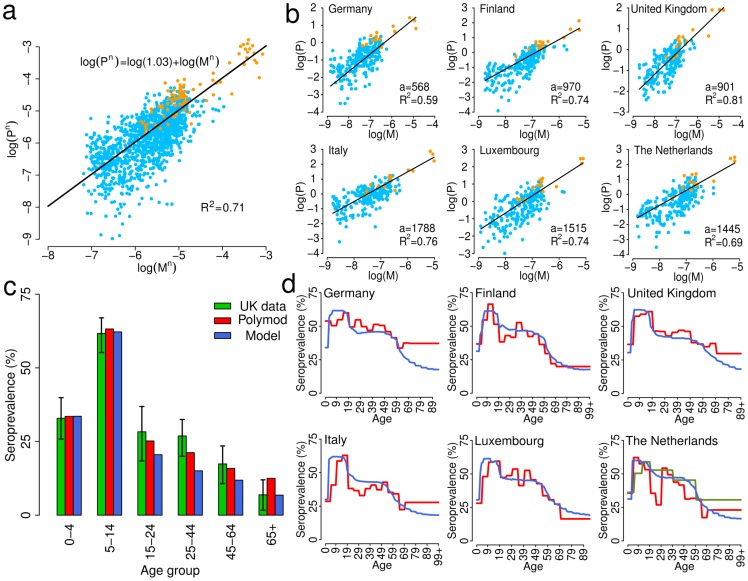
 against those from our model,
  (results shown in logarithmic scale). All countries are considered together and every matrix is normalized so that the sum of its elements is one. Yellow dots refer to the terms on the diagonal, light blue dots correspond to the other entries of the matrices. The value for the regression coefficient is 1.03 and the coefficient of determination
  results to be 0.71. b As in a but for each country singularly, without matrix normalization. In every plot the values for the regression coefficient
  and the coefficient of determination
  are reported. c Green bars represent the average seroprevalence of H1N1 influenza infections in England and Wales during the 2009 pandemic as estimated in a serosurvey (in that study a titre
  for haemagglutination inhibition has been considered for defining seroconversion in the population) and the black lines represent the 95%CI. Blue bars represent the seroprevalence as obtained by simulating a SIR model with
  using our contact matrix. Red bars represent the seroprevalence as obtained by simulating a SIR model with
  using the Polymod contact matrix. d Simulated seroprevalence profiles by age. using Polymod (red) and our matrices (blue), for an epidemic emerging in a completely susceptible population, assuming
  . In the plot for the Netherlands the profile obtained using the matrix from is also shown (dark green).
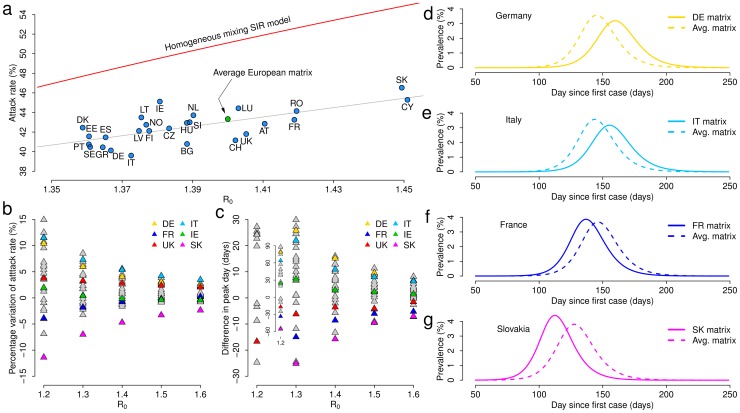
 in the different countries (blue dots) by adopting country-specific matrices and by assuming the same probability of transmission
  in all countries – specifically, the value resulting in
  by adopting the average European matrix (green dot). The attack rate corresponding to the average European matrix is computed by assuming the average European age structure in the model. Red line represents the attack rate of the homogeneous mixing SIR model for values of
  in the range of variability of the basic reproduction number of country-specific matrices. Grey line represents the best fit of the linear model to data points related to the use of country-specific matrices. b Percentage variation of infection attack rate for increasing values of
  of models based on country-specific matrices with respect to models based on the average European matrix (with country-specific age structure). c As b but for the variation of the peak day. d–g Daily prevalence over time of models with
  based on either the country-specific matrix (solid lines) or the average European matrix (dashed lines, with country-specific age structure) in Germany, Italy, France and Slovakia respectively. In this figure we assume the generation time to be 3.1 days.
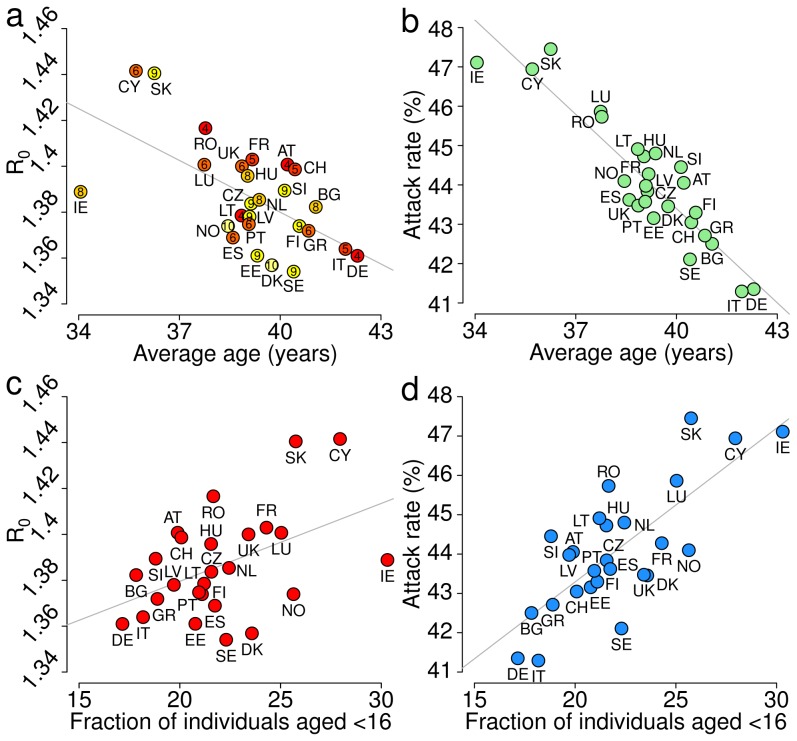
 as a function of the average age of the population in the different countries. Numbers inside the circles represent the duration (in years) of the primary school cycle; colors from red to yellow are proportional to those numbers. b Final attack rate as a function of the average age of the population in the different countries. c Basic reproduction number as a function of the fraction of individuals younger than 16 years of age in the different countries. d Final attack rate as a function of the fraction of individuals younger than 16 years of age in the different countries.
Similar articles
-
Measures of disassortativeness and their application to directly transmitted infections.Biom J. 2009 Jun;51(3):387-407. doi: 10.1002/bimj.200800160. Biom J. 2009. PMID: 19492337
-
Infectious disease control using contact tracing in random and scale-free networks.J R Soc Interface. 2006 Feb 22;3(6):55-62. doi: 10.1098/rsif.2005.0079. J R Soc Interface. 2006. PMID: 16849217 Free PMC article.
-
Inferring epidemic contact structure from phylogenetic trees.PLoS Comput Biol. 2012;8(3):e1002413. doi: 10.1371/journal.pcbi.1002413. Epub 2012 Mar 8. PLoS Comput Biol. 2012. PMID: 22412361 Free PMC article.
-
Networks and epidemic models.J R Soc Interface. 2005 Sep 22;2(4):295-307. doi: 10.1098/rsif.2005.0051. J R Soc Interface. 2005. PMID: 16849187 Free PMC article. Review.
-
HIV in central and eastern Europe.Lancet. 2003 Mar 22;361(9362):1035-44. doi: 10.1016/S0140-6736(03)12831-0. Lancet. 2003. PMID: 12660072 Review.
Cited by
-
Using models to shape measles control and elimination strategies in low- and middle-income countries: A review of recent applications.Vaccine. 2020 Jan 29;38(5):979-992. doi: 10.1016/j.vaccine.2019.11.020. Epub 2019 Nov 29. Vaccine. 2020. PMID: 31787412 Free PMC article. Review.
-
fluEvidenceSynthesis: An R package for evidence synthesis based analysis of epidemiological outbreaks.PLoS Comput Biol. 2017 Nov 20;13(11):e1005838. doi: 10.1371/journal.pcbi.1005838. eCollection 2017 Nov. PLoS Comput Biol. 2017. PMID: 29155812 Free PMC article.
-
Model-based evaluation of alternative reactive class closure strategies against COVID-19.Nat Commun. 2022 Jan 14;13(1):322. doi: 10.1038/s41467-021-27939-5. Nat Commun. 2022. PMID: 35031600 Free PMC article.
-
Quantifying the transmission dynamics of MRSA in the community and healthcare settings in a low-prevalence country.Proc Natl Acad Sci U S A. 2019 Jul 16;116(29):14599-14605. doi: 10.1073/pnas.1900959116. Epub 2019 Jul 1. Proc Natl Acad Sci U S A. 2019. PMID: 31262808 Free PMC article.
-
Theory and data for simulating fine-scale human movement in an urban environment.J R Soc Interface. 2014 Oct 6;11(99):20140642. doi: 10.1098/rsif.2014.0642. J R Soc Interface. 2014. PMID: 25142528 Free PMC article.
References
-
- Rohani P, Zhong X, King AA (2010) Contact Network Structure Explains the Changing Epidemiology of Pertussis. Science 330: 982–985. - PubMed
Publication types
MeSH terms
Grants and funding
LinkOut - more resources
Full Text Sources
Medical
