

Inferring correlation networks from genomic survey data
- PMID: 23028285
- PMCID: PMC3447976
- DOI: 10.1371/journal.pcbi.1002687
Inferring correlation networks from genomic survey data
Abstract
High-throughput sequencing based techniques, such as 16S rRNA gene profiling, have the potential to elucidate the complex inner workings of natural microbial communities - be they from the world's oceans or the human gut. A key step in exploring such data is the identification of dependencies between members of these communities, which is commonly achieved by correlation analysis. However, it has been known since the days of Karl Pearson that the analysis of the type of data generated by such techniques (referred to as compositional data) can produce unreliable results since the observed data take the form of relative fractions of genes or species, rather than their absolute abundances. Using simulated and real data from the Human Microbiome Project, we show that such compositional effects can be widespread and severe: in some real data sets many of the correlations among taxa can be artifactual, and true correlations may even appear with opposite sign. Additionally, we show that community diversity is the key factor that modulates the acuteness of such compositional effects, and develop a new approach, called SparCC (available at https://bitbucket.org/yonatanf/sparcc), which is capable of estimating correlation values from compositional data. To illustrate a potential application of SparCC, we infer a rich ecological network connecting hundreds of interacting species across 18 sites on the human body. Using the SparCC network as a reference, we estimated that the standard approach yields 3 spurious species-species interactions for each true interaction and misses 60% of the true interactions in the human microbiome data, and, as predicted, most of the erroneous links are found in the samples with the lowest diversity.
Conflict of interest statement
The authors have declared that no competing interests exist.
Figures
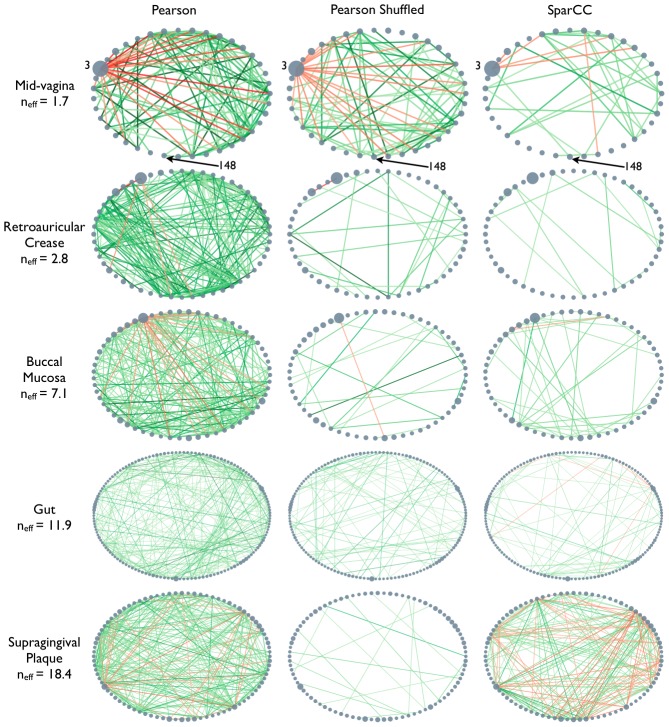
 , used in the simulations and observed in the HMP data are indicated on left indicates. As in Fig. 1, nodes represent OTUs, with size reflecting the OTU's average fraction in the community. Nodes represent OTUs, with size reflecting the OTU's average fraction in the community. Edges between nodes represent correlations between the nodes they connect, with edge width and shade indicating the correlation magnitude, and green and red colors indicating positive and negative correlations, respectively. For clarity, only edges corresponding to correlations whose magnitude is greater than 0.3 are drawn.
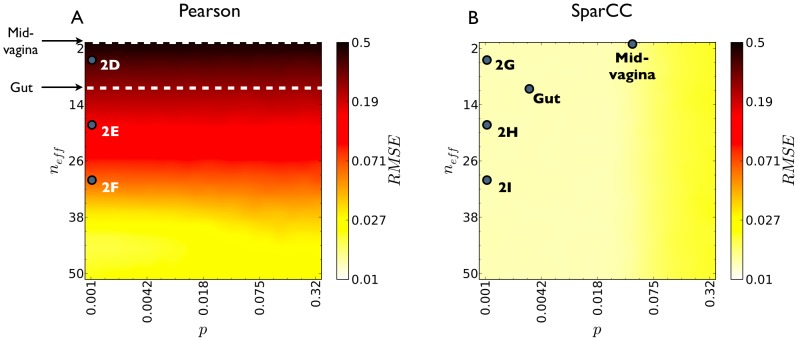
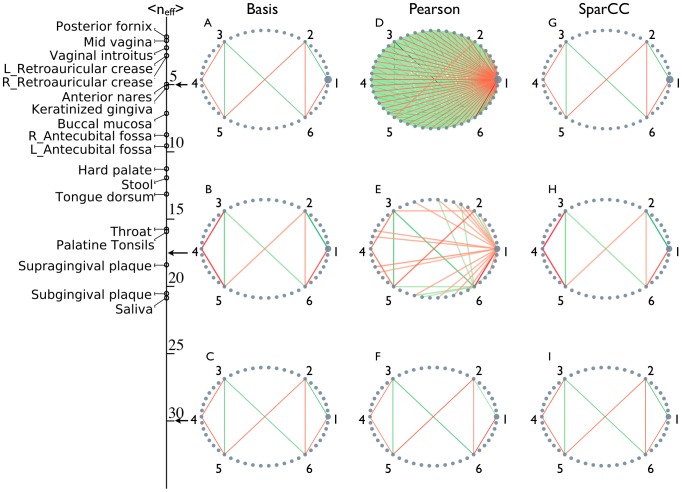
 , and community diversity, as given by the Shannon entropy effective number of components
  . SparCC errors are smaller than Pearson errors for all parameter values. For the maximal diversity plotted, 50 effective OTU, the inference error obtained using Pearson correlations is greatly decreased. Therefore, it is likely that Pearson correlations perform well on gene expression data, where the effective number of genes is typically in the hundreds or thousands. For each combination of density and diversity, multiple basis correlation networks were randomly generated, and corresponding data was sampled and used for correlation estimation. Dots labeled mid-vagina and gut indicate the average diversity observed in the mid-vagina and gut communities, and the density of their estimated correlation networks. Dots labeled 2D–I indicate the diversity and density used to generate the communities analyzed in Fig. 2.
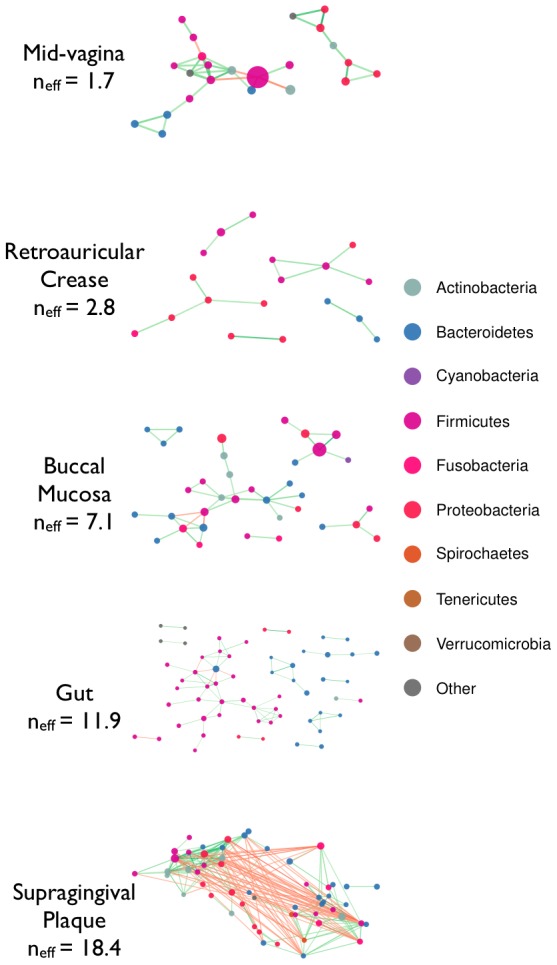
References
Publication types
MeSH terms
LinkOut - more resources
Full Text Sources
Other Literature Sources
