. 2012;8(9):e1002690.
doi: 10.1371/journal.pcbi.1002690. Epub 2012 Sep 27.

Enhancing the prioritization of disease-causing genes through tissue specific protein interaction networks

Affiliations

Enhancing the prioritization of disease-causing genes through tissue specific protein interaction networks

Oded Magger et al. PLoS Comput Biol. 2012.

Abstract

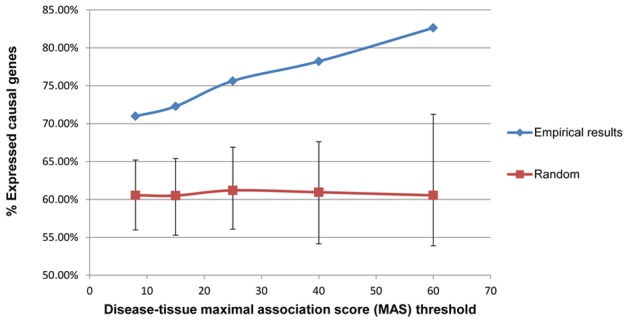
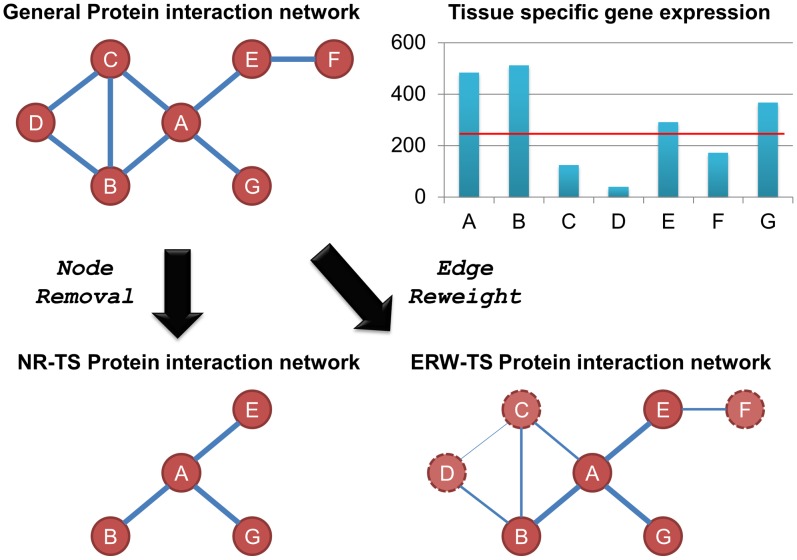
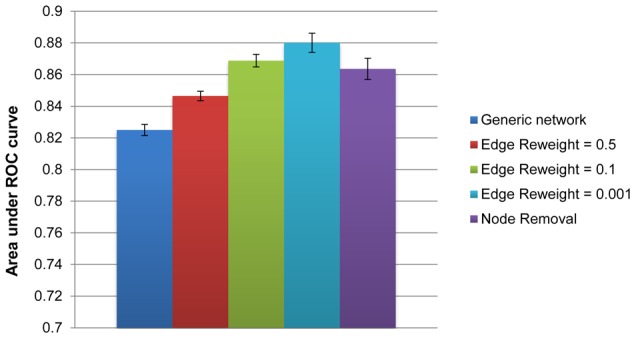
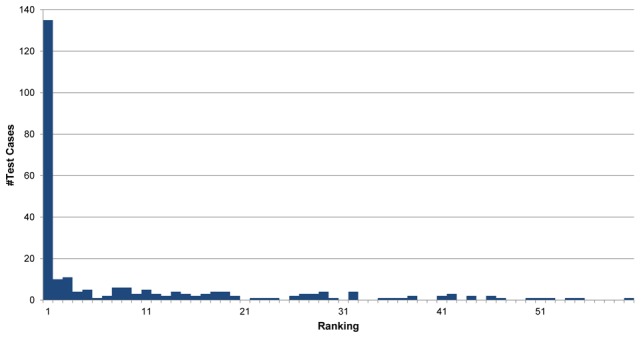
The prioritization of candidate disease-causing genes is a fundamental challenge in the post-genomic era. Current state of the art methods exploit a protein-protein interaction (PPI) network for this task. They are based on the observation that genes causing phenotypically-similar diseases tend to lie close to one another in a PPI network. However, to date, these methods have used a static picture of human PPIs, while diseases impact specific tissues in which the PPI networks may be dramatically different. Here, for the first time, we perform a large-scale assessment of the contribution of tissue-specific information to gene prioritization. By integrating tissue-specific gene expression data with PPI information, we construct tissue-specific PPI networks for 60 tissues and investigate their prioritization power. We find that tissue-specific PPI networks considerably improve the prioritization results compared to those obtained using a generic PPI network. Furthermore, they allow predicting novel disease-tissue associations, pointing to sub-clinical tissue effects that may escape early detection.


Conflict of interest statement

The authors have declared that no competing interests exist.

Figures

Figure 1
Figure 1. The fraction of disease genes expressed in the disease's assigned tissue correlates with MAS Threshold.
The fraction of disease-causing genes expressed in the tissue of their pertaining disease, compared to the random expectation (obtained through a permutation test; Methods), for different MAS thresholds. The error bars represent the minimal and maximal fraction of expressed genes observed at random (over 10,000 permutations) for each MAS threshold. Total number of associations is (from lower to higher MAS): 920, 812, 583, 349 and 167.
Figure 2
Figure 2. A summary of tissue-specific PPI network reconstruction methods.
First, we determine the set of expressed genes in a given tissue based on an expression cutoff of 200 Affymetrix AD units. The set of expressed genes is then superimposed on the general PPI using one of two strategies: (a) Node Removal – removing genes which are considered unexpressed from the network. (b) Edge Reweight - Reducing the weight of an edge connecting one or two unexpressed genes. This results in a tissue specific PPI network.
Figure 3
Figure 3. Comparing generic and tissue-specific PPIs' performance in candidate disease genes prioritization.
Performance comparison between the generic and different variants of tissue-specific PRINCE, according to the ROC Area under curve (AUC) of causal gene prediction in a leave-one-out cross validation test. Error bars represent the standard deviation of AUC values obtained when replacing leave-one-out with 25-fold cross validation of ten random partitions. Results are for a disease-tissue MAS threshold of 40%.
Figure 4
Figure 4. Evaluation of tissue-disease association prediction.
The histogram shows the distribution of our disease-tissue ranking for the tissues assigned by Lage et al. in every test case (disease-gene association). As can be seen, in more than half of the cases the associated tissue was predicted first among all other tissues.

References

    1. Schunkert H, König IR, Kathiresan S, Reilly MP, Assimes TL, et al. (2011) Large-scale association analysis identifies 13 new susceptibility loci for coronary artery disease. Nat Genet 43: 333–338. - PMC - PubMed
    1. Birnbaum S, Ludwig KU, Reutter H, Herms S, Steffens M, et al. (2009) Key susceptibility locus for nonsyndromic cleft lip with or without cleft palate on chromosome 8q24. Nat Genet 41: 473–477. - PubMed
    1. Kathiresan S, Voight BF, Purcell S, Musunuru K, Ardissino D, et al. (2009) Genome-wide association of early-onset myocardial infarction with single nucleotide polymorphisms and copy number variants. Nat Genet 41: 334–341. - PMC - PubMed
    1. Vanunu O, Magger O, Ruppin E, Shlomi T, Sharan R (2010) Associating genes and protein complexes with disease via network propagation. PLoS Comput Biol 6: e1000641. - PMC - PubMed
    1. Köhler S, Bauer S, Horn D, Robinson PN (2008) Walking the interactome for prioritization of candidate disease genes. Am J Hum Genet 82: 949–958. - PMC - PubMed

Publication types