. 2012 Sep;8(9):e1002946.
doi: 10.1371/journal.ppat.1002946. Epub 2012 Sep 27.

Global assessment of genomic regions required for growth in Mycobacterium tuberculosis

Affiliations

Global assessment of genomic regions required for growth in Mycobacterium tuberculosis

Yanjia J Zhang et al. PLoS Pathog. 2012 Sep.

Erratum in

  • PLoS Pathog. 2013;9(7). doi:10.1371/annotation/4669e9e7-fd12-4a01-be2a-617b956ec0bb

Abstract

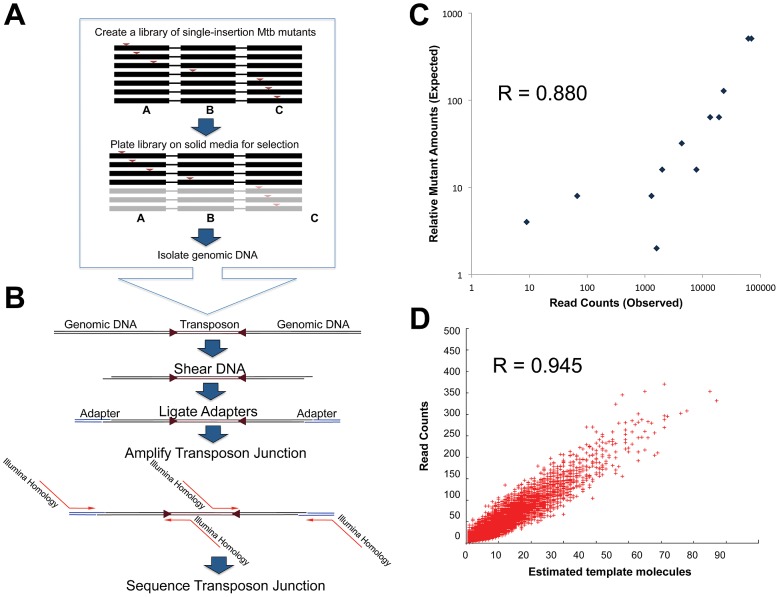
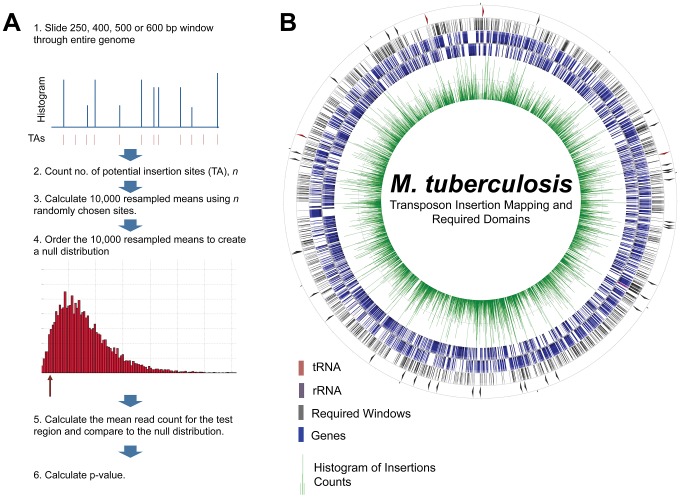
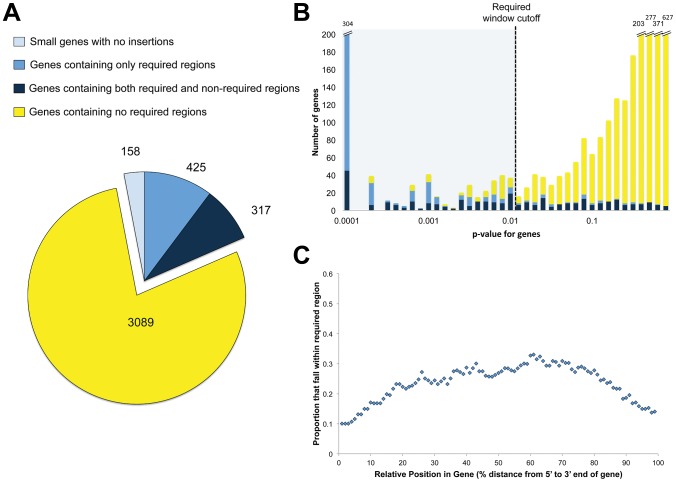
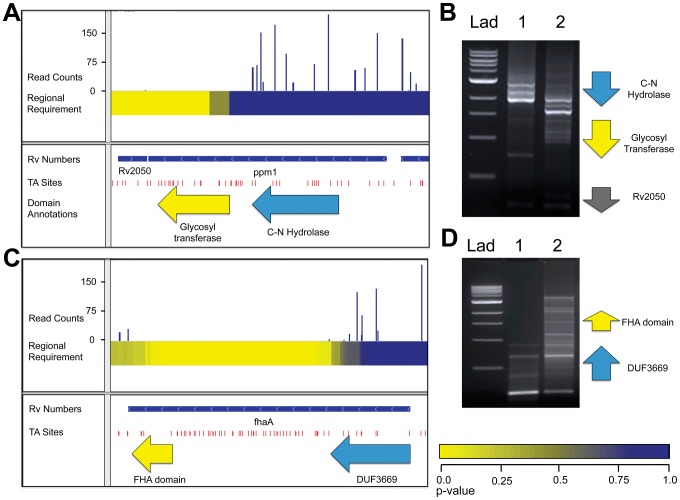
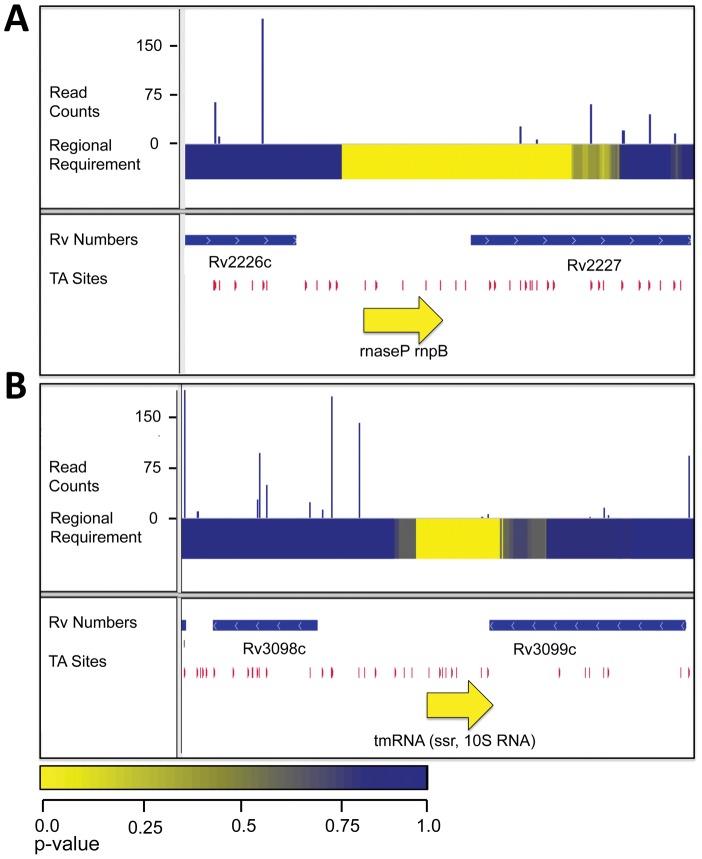
Identifying genomic elements required for viability is central to our understanding of the basic physiology of bacterial pathogens. Recently, the combination of high-density mutagenesis and deep sequencing has allowed for the identification of required and conditionally required genes in many bacteria. Genes, however, make up only a part of the complex genomes of important bacterial pathogens. Here, we use an unbiased analysis to comprehensively identify genomic regions, including genes, domains, and intergenic elements, required for the optimal growth of Mycobacterium tuberculosis, a major global health pathogen. We found that several proteins jointly contain both domains required for optimal growth and domains that are dispensable. In addition, many non-coding regions, including regulatory elements and non-coding RNAs, are critical for mycobacterial growth. Our analysis shows that the genetic requirements for growth are more complex than can be appreciated using gene-centric analysis.


Conflict of interest statement

The authors have declared that no competing interests exist.

Figures

Figure 1
Figure 1. Transposon junction sequencing accurately reflects true library content.
A. A Mtb mutant library is created by phage-delivery of transposons, disrupting each genome with a single insertion. Shown is a schematic of 6 mutant chromosomes spanning three genes (A–C), with transposons—red arrows—disrupting one of the three genes. After growing the library on 7H10 media, we pooled surviving mutants. In this schematic, gene C is required for optimal growth and thus mutants with transposons in gene C are lost. We isolated genomic DNA from the survivors for transposon site mapping. B. We sheared the genomic DNA by sonication, and repaired frayed ends to create blunt ends. We then used Taq polymerase to generate A-tails, allowing the ligation of T-tailed adapters. Finally, we selectively amplified transposon junctions using primers recognizing the transposon end and the adapter. Primers used for amplification contain all requisite sequences to permit direct sequencing of amplicons on an Illumina Genome Analyzer 2. C. We created a library of identified transposon insertion mutants in known relative quantities. DNA from the library was prepared for transposon junction sequencing. Insertion counts were plotted against the known relative quantity of the mutant in the library. D. To further confirm that read counts were a representation of the number of genomes in the library, we estimated the number of PCR template molecules. For each gene, we plotted the estimate of template molecule count against the read counts.
Figure 2
Figure 2. Functional requirement testing and mapping.
A. Required regions were defined as regions with a statistical underrepresentation of insertion counts compared to the rest of the genome. To test this, we applied a non-parametric test for regions of increasing size, as described in B. Every 250, 400, 500, and 600 bp region (large enough for statistical power) was tested for insertion count underrepresentation, generating a comprehensive map of required regions in the Mtb genome. Tracks on the circularized genome, from inner-most to outer-most: 1. Histogram of insertion counts, 2. Annotated genes, forward direction, 3. Annotated genes, reverse direction, 4. All required regions. 5. Required intergenic regions.
Figure 3
Figure 3. Domain discovery.
A. Genes categorized by domain-level resolution of regional requirement. B. Genes categorized as containing only required regions (blue), containing both required and non-required regions (navy) and containing no required regions (yellow) were assessed for requirement along the entire length of the gene, creating a single p-value describing the statistical underrepresentation of insertion reads within the whole gene. For each category, the number of genes across the range of p-values are plotted. C. For genes with both required and non-required regions, the likelihood that the relative position within the gene resides in a required region.
Figure 4
Figure 4. ppm1 and fhaA each code for two domains with varying requirements for growth.
A. IGV plot for genomic region containing ppm1. Tracks, from top to bottom: 1. Histogram of insertion counts, 2. Comprehensive heat-map of requirement of 500-bp windows, 3. Position of annotated genes, 4. TA sites, 5. Position of known domains within ppm1. B. PCR footprinting for insertions was performed using primers against the an upstream genomic region and the transposon end, resulting in amplicons spanning ppm1 to various inserted transposons. Lad: 1 kb DNA ladder, 1: wt Mtb transposon library, 2: ppm1-complemented Mtb transposon library. C. IGV plot for genomic region containing ppm1. Tracks, from top to bottom: 1. Histogram of insertion counts, 2. Comprehensive heat-map of requirement of 500-bp windows, 3. Position of annotated genes, 4. TA sites. D. PCR footprinting for insertions was performed using primers against the an upstream genomic region and the transposon end, resulting in amplicons spanning fhaA to various inserted transposons. Lad: 1 kb DNA ladder, 1: wt Mtb transposon library, 2: fhaA-complemented Mtb transposon library.
Figure 5
Figure 5. RNAs required for growth in vitro.
A. IGV plot for genomic region containing the rnpB, the RNA component of RNaseL. Tracks, from top to bottom: 1. Histogram of insertion counts, 2. Comprehensive heat-map of requirement of 500-bp windows, 3. Position of annotated genes, 4. Position of TA dinucleotide sites, 5. Position of rnpB. B. IGV plot for genomic region containing the tmRNA. Tracks, from top to bottom: 1. Histogram of insertion counts, 2. Comprehensive heat-map of requirement of 500-bp windows, 3. Position of annotated genes, 4. Position of TA dinucleotide sites, 5. Position of the tmRNA.

References

    1. Gawronski JD, Wong SMS, Giannoukos G, Ward DV, Akerley BJ (2009) Tracking insertion mutants within libraries by deep sequencing and a genome-wide screen for Haemophilus genes required in the lung. Proc Natl Acad Sci U S A 106: 16422–16427 doi:10.1073/pnas.0906627106. - DOI - PMC - PubMed
    1. Goodman AL, Mcnulty NP, Zhao Y, Leip D, Mitra RD, et al. (2009) Identifying Genetic Determinants Needed to Establish a Human Gut Symbiont in Its Habitat. Cell Host Microbe 6: 279–289 doi:10.1016/j.chom.2009.08.003. - DOI - PMC - PubMed
    1. Griffin JE, Gawronski JD, DeJesus MA, Ioerger TR, Akerley BJ, et al. (2011) High-resolution phenotypic profiling defines genes essential for mycobacterial growth and cholesterol catabolism. PLoS Pathog 7: e1002251 doi:10.1371/journal.ppat.1002251. - DOI - PMC - PubMed
    1. Langridge GC, Phan M-D, Turner DJ, Perkins TT, Parts L, et al. (2009) Simultaneous assay of every Salmonella Typhi gene using one million transposon mutants. Genome Res 19: 2308–2316 doi:10.1101/gr.097097.109. - DOI - PMC - PubMed
    1. van Opijnen T, Bodi KL, Camilli A (2009) Tn-seq: high-throughput parallel sequencing for fitness and genetic interaction studies in microorganisms. Nat Methods 6: 767–772 doi:10.1038/nmeth.1377. - DOI - PMC - PubMed

Publication types

MeSH terms