. 2012 Sep;8(9):e1002924.
doi: 10.1371/journal.pgen.1002924. Epub 2012 Sep 20.

Vsx2 controls eye organogenesis and retinal progenitor identity via homeodomain and non-homeodomain residues required for high affinity DNA binding

Affiliations

Vsx2 controls eye organogenesis and retinal progenitor identity via homeodomain and non-homeodomain residues required for high affinity DNA binding

Changjiang Zou et al. PLoS Genet. 2012 Sep.

Abstract

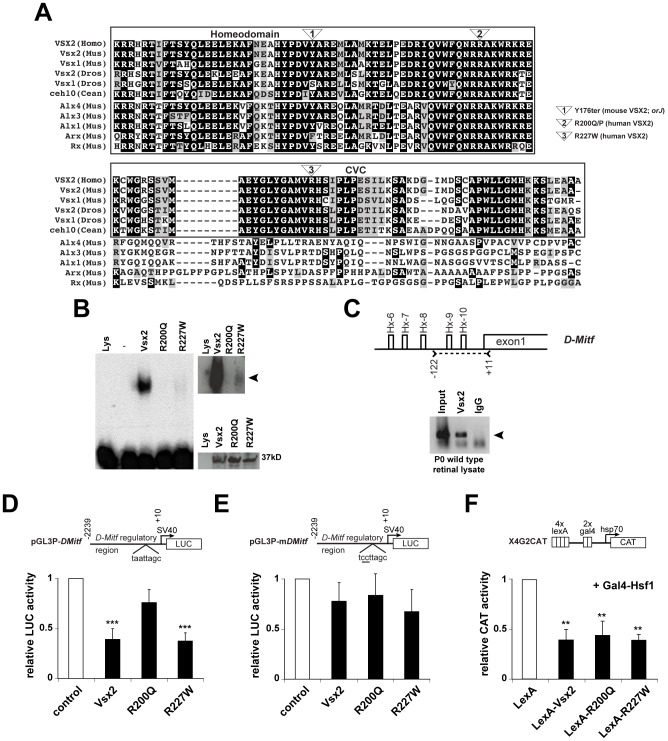
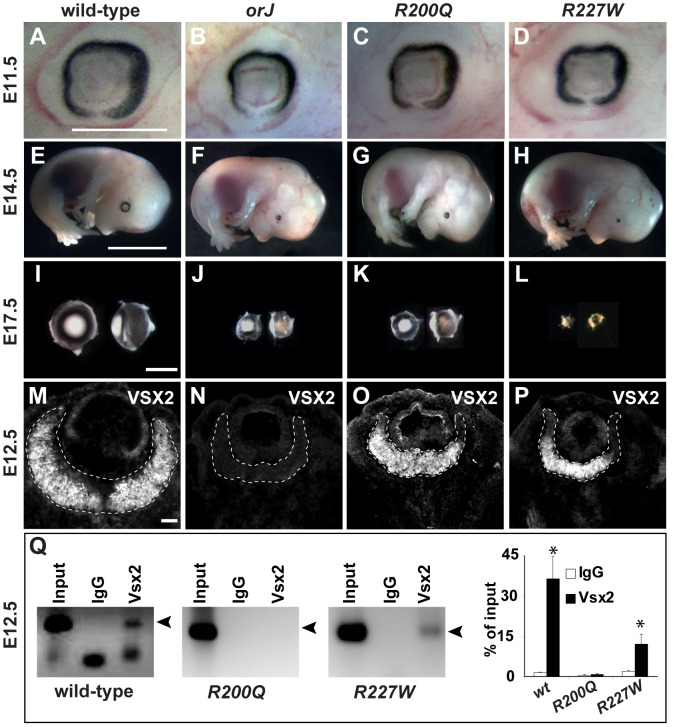
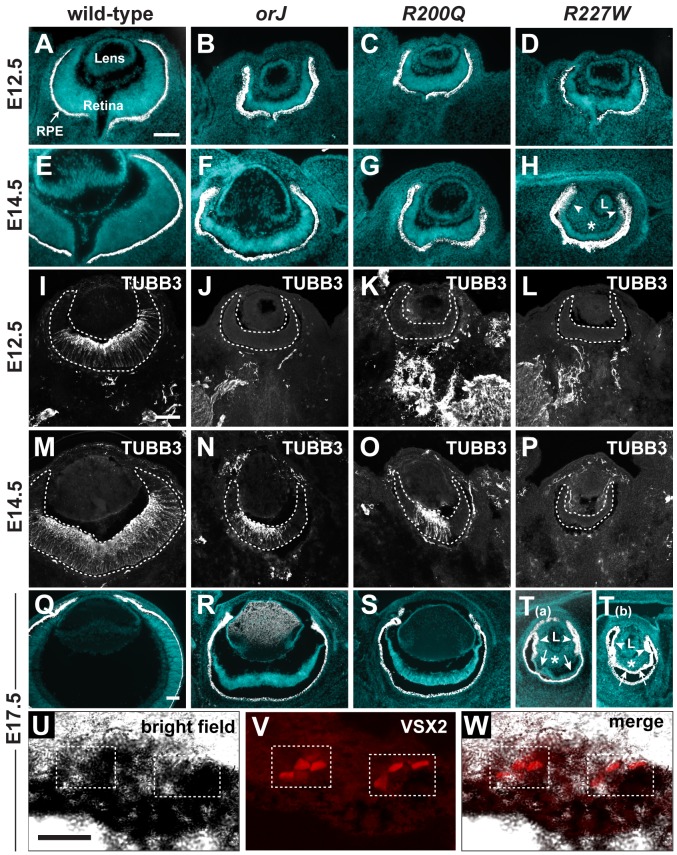
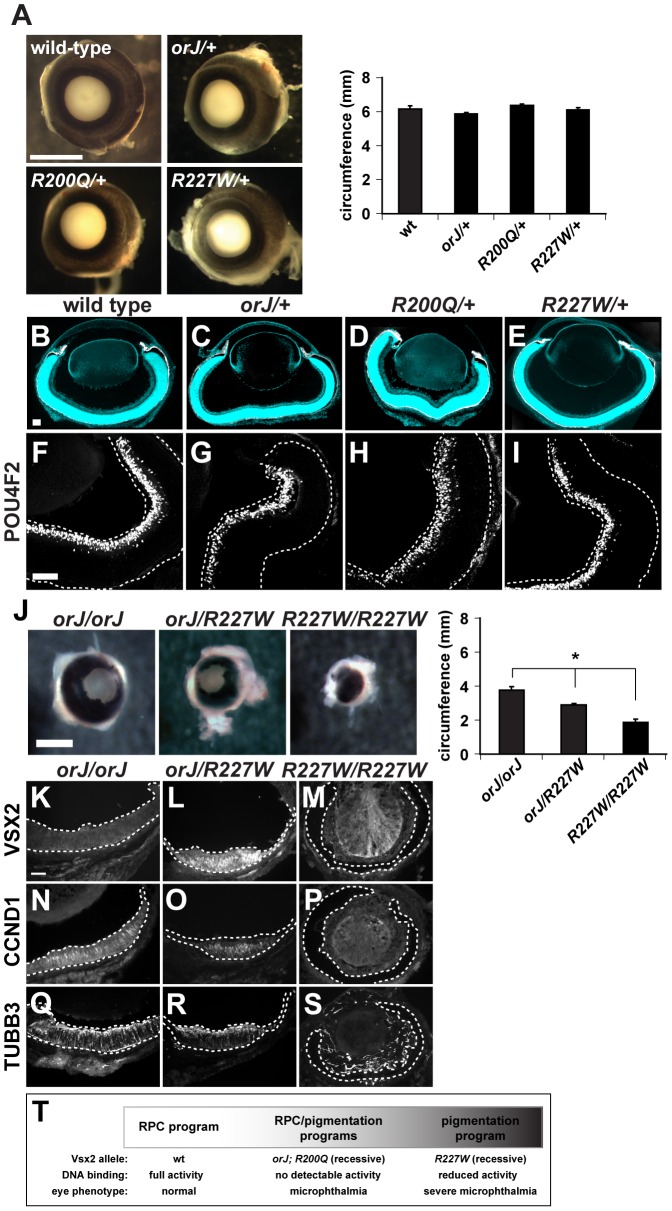
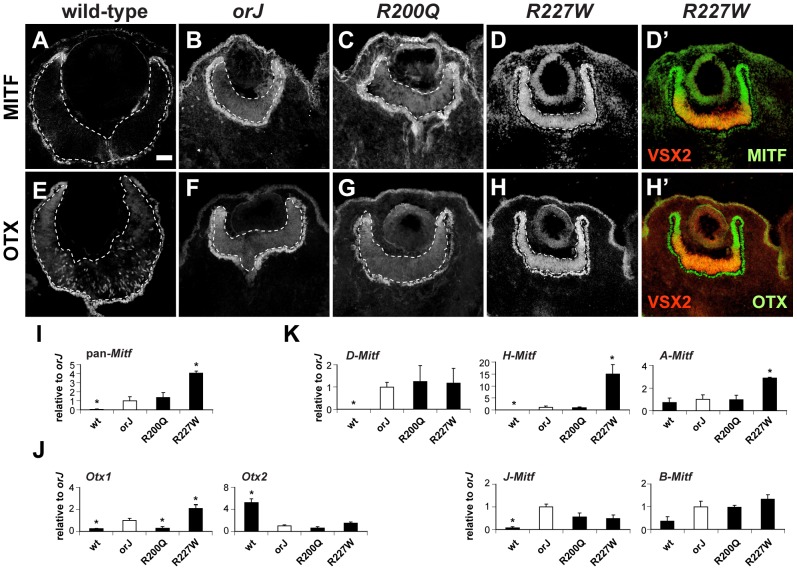
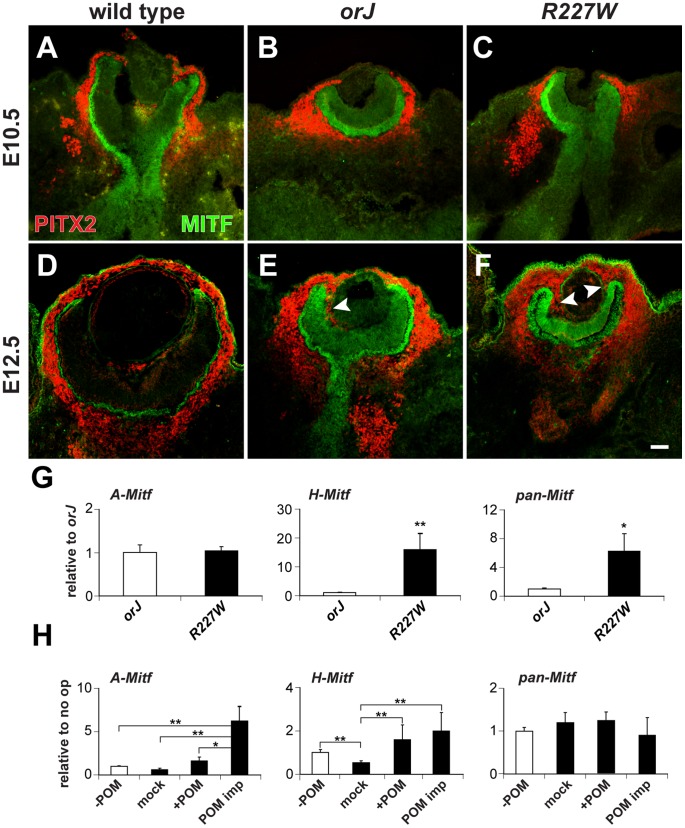
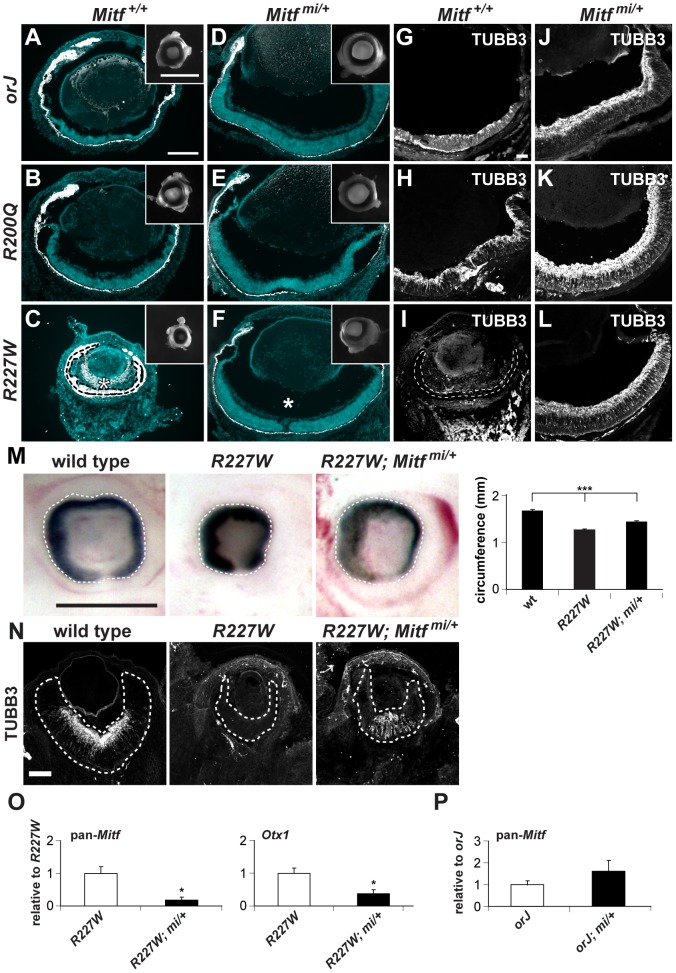
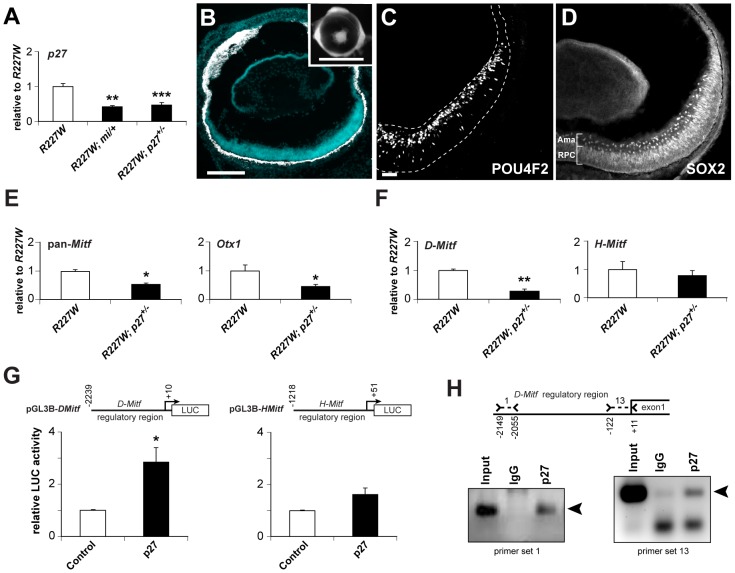
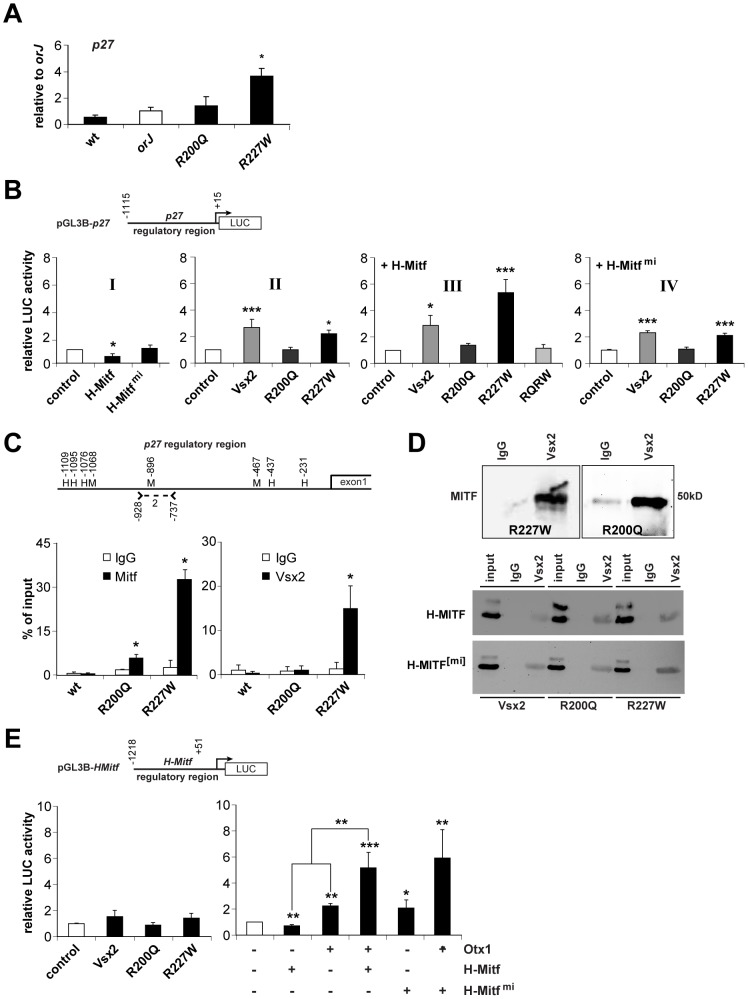
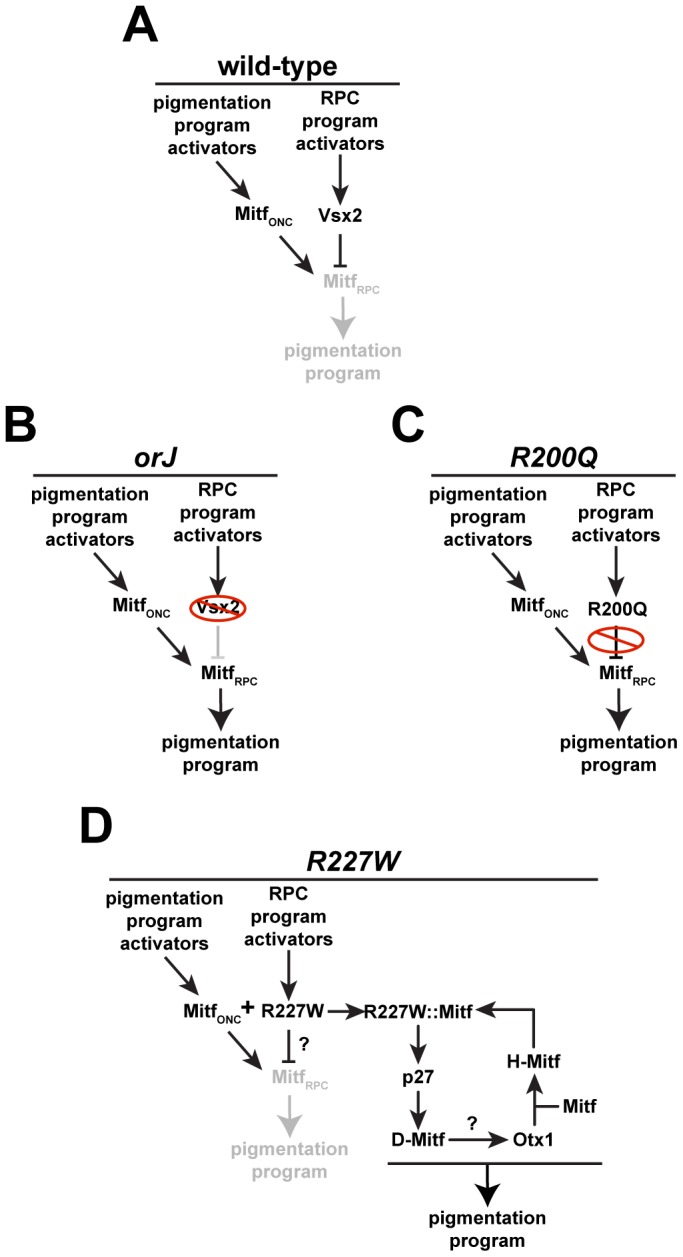
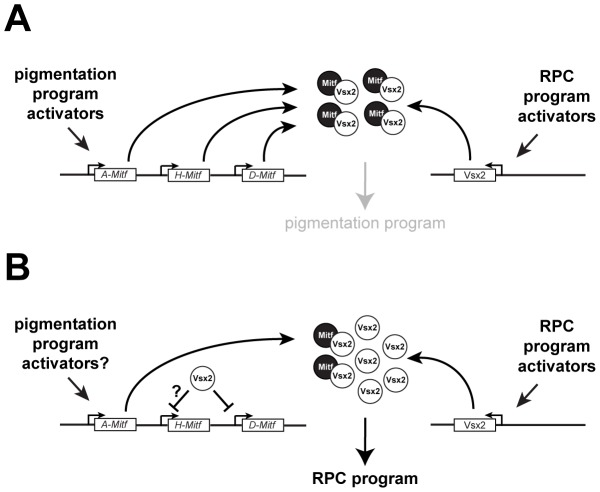
The homeodomain and adjacent CVC domain in the visual system homeobox (VSX) proteins are conserved from nematodes to humans. Humans with missense mutations in these regions of VSX2 have microphthalmia, suggesting both regions are critical for function. To assess this, we generated the corresponding mutations in mouse Vsx2. The homeodomain mutant protein lacked DNA binding activity and the knock-in mutant phenocopied the null mutant, ocular retardation J. The CVC mutant protein exhibited weakened DNA binding; and, although the corresponding knock-in allele was recessive, it unexpectedly caused the strongest phenotype, as indicated by severe microphthalmia and hyperpigmentation of the neural retina. This occurred through a cryptic transcriptional feedback loop involving the transcription factors Mitf and Otx1 and the Cdk inhibitor p27(Kip1). Our data suggest that the phenotypic severity of the CVC mutant depends on the weakened DNA binding activity elicited by the CVC mutation and a previously unknown protein interaction between Vsx2 and its regulatory target Mitf. Our data also suggest that an essential function of the CVC domain is to assist the homeodomain in high-affinity DNA binding, which is required for eye organogenesis and unhindered execution of the retinal progenitor program in mammals. Finally, the genetic and phenotypic behaviors of the CVC mutation suggest it has the characteristics of a recessive neomorph, a rare type of genetic allele.


Conflict of interest statement

The authors have declared that no competing interests exist.

Figures

Figure 1
Figure 1. DNA binding and transcriptional activities of VSX2 and the VSX2[R200Q] and VSX2[R227W] variants.
(A) ClustalW alignment of the homeodomain and adjacent 60 amino acids in select VSX orthologs and the most similar non-VSX proteins in mice. Only the VSX sequences have a discernable CVC domain. The positions of the orJ, R200Q, and R227W mutations are shown. (B) Left panel: EMSA with in vitro translated VSX2, VSX2[R200Q], and VSX2[R227W] proteins and P-labeled P3 oligo (see Table S1 for sequence). Top right panel: Extended exposure reveals weak binding by VSX2[R227W]. Bottom right panel: Western blot of in vitro translated proteins with VSX2 antibody (Lys, control lysate; -, P3 probe only). (C) Schematic shows five putative Vsx2 binding sites (Hx-6 – Hx-10) in the proximal promoter region (∼0.3 kb) of D-Mitf. Carats and dashed line marks the region of PCR amplification in the ChIP assay shown below schematic (primer set 13; Table S1). Arrowhead points to sequence-verified ChIP product. (D) Luciferase assays in P0 primary retinal cells transfected with the indicated expression vectors (x-axis) and ∼2.2 kb of the D-Mitf promoter region (pGL3P-DMitf). (E) The Hx-9 site was mutated in pGL3P-mDMitf to eliminate DNA binding at that site. Reporter assays were normalized to empty vector controls (white bars). (F) CAT assays in HEK293 cells transfected with the X4G2CAT reporter and VSX2 variants fused to the LexA DNA binding domain. Gal4-Hsf1 was included to stimulate high basal reporter activity . ** P≤0.01; *** P≤0.001.
Figure 2
Figure 2. The R200Q and R227W mutations cause non-syndromic congenital microphthalmia.
(A–D) Mice homozygous for the orJ, R200Q, and R227W alleles had smaller eyes than wild-type by E11.5. (E–H) At E14.5, overall embryonic development was unaffected in the mutants, but the failure of the mutant eyes to keep pace with the growth of the wild-type eye was evident. Eye growth in the R227W mutant also failed to keep pace with the orJ and R200Q mutants. (I–L) Dissected E17.5 eyes (right eyes rotated 90°) show similar reductions in eye size in orJ and R200Q homozygotes whereas the reduction in eye size of R227W homozygotes was the most severe. (M–P) VSX2 immunohistochemistry in E12.5 retinas. VSX2 protein was not detected in the orJ retina, confirming it as an expression null. VSX2[R200Q] and VSX2[R227W] were expressed similarly to VSX2[wt], although to a reduced extent in peripheral retina. Dashed lines bound retinas. (Q) ChIP assays with VSX2 antibody reacted with E12.5 native chromatin lysates from wild-type, R200Q, and R227W retinas and amplified using D-Mitf primer set 13 (Table S1). Arrowhead denotes amplification product. Graph shows quantification results of ChIP-qPCR. Scale bars: 0.5 mm (E11.5); 5 mm (E14.5); 1 mm (E17.5).
Figure 3
Figure 3. Ocular histology and neurogenesis in Vsx2 mutants.
(A–H) Merged images of cryosections showing DAPI staining (blue) and melanogenic pigmentation (white) for each of the indicated genotypes and ages. Arrowheads in H point to aberrant pigmentation in peripheral retina asterisk denotes ectopic periocular mesenchyme (POM) in vitreal cavity. (I–P) Expression patterns of the neuronal differentiation marker class III β-Tubulin (TUBB3). Neurogenesis lagged behind wild-type and to a similar extent in the orJ and R200Q retinas, but did not initiate in the R227W retina. (Q–T) Merged images of cryosections showing DAPI staining (blue) and melanogenic pigmentation (white) for each of the indicated genotypes at E17.5. The R227W retina was aberrantly pigmented, either partially (T(a)) or completely (T(b)). Arrowheads in T(a) and T(b) point to aberrant pigmentation in peripheral retina, arrows to central retinal regions, and asterisks to ectopic pigmentation in vitreal cavity. (U–W) Pigmented cells expressing VSX2[R227W] were detected in pigmented retinal region. L, lens; RPE, retinal pigment epithelium. Scale bars: 100 µm (A–T), 20 µm (U–W).
Figure 4
Figure 4. The R200Q and R227W alleles and proteins do not exhibit dominant behavior.
(A) Wild-type, orJ/+, R200Q/+, and R227W/+ eyes were indistinguishable at P0. No significant differences in eye circumferences were detected. (B–E) Merged images of cryosections showing DAPI staining (blue) and melanogenic pigmentation (white) for each of the indicated genotypes at P0. (F–I) Expression of the retinal ganglion cell marker POU4F2 in wild-type or Vsx2 heterozygous retinas. (J) Eye circumference of orJ/R227W heterozygotes was intermediate to orJ and R227W homozygotes. (K–S) Expression of VSX2, CCND1, and TUBB3 in orJ, orJ/R227W, and R227W retinas at P0. VSX2 was detected in the orJ/R227W retina only. CCND1 and TUBB3 were detected in orJ or orJ/R227W retinas but not in R227W pigmented retina. (T) Genotype-phenotype correlation of Vsx2 alleles arranged by retinal phenotype. * P≤0.05 Scale bars: 1 mm (A, J); 100 µm (B–I, K–S).
Figure 5
Figure 5. Phenotypic severity correlates with the expression levels of Mitf and Otx1.
(A–D) MITF expression at E12.5 for the indicated genotypes. The R227W retina expressed MITF at much higher levels compared to the orJ and R200Q mutants. (D′) Merged images of VSX2[R227W] (red) and MITF (green) shows overlap in expression. The lack of VSX2[R227W] expression in the peripheral retina corresponded to the highest levels of MITF. (E–H) OTX expression at E12.5 for the indicated genotypes. OTX expression was highest in the R227W retina. (H′) Merged images of VSX2[R227W] (red) and OTX (green). Like MITF, OTX expression was highest in regions lacking VSX2[R227W]. MITF and OTX were also expressed in RPE (outside lower dashed lines). (I–K) Relative mRNA expression levels of pan-Mitf (I), Otx1 and Otx2 (J), and the D-, H-, A-, J-, and B-Mitf isoforms (K) in E12.5 retinas of the indicated genotypes as determined by qRT-PCR. Samples were normalized to the expression level for each transcript in the orJ retina (white bars). * P≤0.05 Scale bar: 50 µm.
Figure 6
Figure 6. Influence of POM on Mitf expression in the R227W retina.
(A–F) PITX2 (red) and MITF (green) expression at E10.5 (A–C) and E12.5 (D–F). Limited PITX2+ cells were detected in the vitreal chamber (between retina and lens) of wild-type eyes. PITX2+ cells were not detected in the vitreal chamber of mutant eyes at E10.5, but were abundant by E12.5 and continuous with POM at the retinal periphery (arrowheads). MITF expression levels were modestly upregulated at E10.5 in the mutant retinas and were clearly elevated by E12.5. (G) Relative expression levels of A-Mitf, H-Mitf, and pan-Mitf in E10.5 whole retina and lens explants cultured for 48 hr. R227W expression levels were normalized to orJ. Invasion of POM into the vitreal chamber did not occur in these cultures (data not shown). (H) Relative expression levels of A-Mitf, H-Mitf, and pan-Mitf in physically manipulated E10.5 R227W whole retina and lens explants cultured for 48 hr after the following manipulations: “−POM” (retina and lens only); “mock” (retina partially separated from lens); “+POM” (retina partially separated from lens with surrounding POM intact); “POM imp” (retina partially separated from lens and POM implanted into vitreal cavity). Expression levels were normalized to the “−POM” condition. * P≤0.05; ** P≤0.01 Scale bar: 50 µm.
Figure 7
Figure 7. The dominant negative allele Mitfmi restores retinal development in the Vsx2 mutants.
(A–F) Merged images of cryosections showing DAPI staining (blue) and melanogenic pigmentation (white) in P0 orj, R200Q, and R227W mice that were Mitf wild-type (Mitf+/+; A–C) and mi heterozygous (Mitfmi/+; D–F). Insets show whole eyes. The retina in C was completely transformed into pigmented tissue (bounded by dashed line) and ectopic POM was partially pigmented (asterisk). Eye size and retinal histology were restored to a comparable degree in all Vsx2, mi compound mutants (D–F). Also notable in the R227W, mi compound mutant was the lack of POM in the vitreal chamber (asterisk in F). (G–L) TUBB3 staining at P0. In all cases, lamination patterns were restored in the compound mutants, indicating robust neurogenesis. Retinal tissue in I is bounded by the dashed lines. (M) The reduced eye size in the R227W mutant was partially rescued in the R227W; Mitfmi/+ mutant at E12.5. (N) The expression of TUBB3 was detected in the R227W; Mitfmi/+ retina at E13.5. (O) Mitf and Otx1 transcript levels were much lower in the R227W; Mitfmi/+ retina (black bars) compared to the R227W mutant (white bars). (P) pan-Mitf transcript level in orJ; Mitfmi/+ retina was not lower than that in orJ retina. * P≤0.05; *** P≤0.001 Scale bars: 100 µm (A–F); 1 mm (insets); 50 µm (G–L); 0.5 mm (M); 100 µm (N).
Figure 8
Figure 8. p27Kip1 is part of a gene regulatory network promoting pigmentation in the R227W retina.
(A) p27 mRNA was reduced by approximately half in R227W; Mitfmi/+ and R227W; p27+/− compound mutant retinas compared to R227W at E12.5. (B–D) Phenotypes of R227W, p27Kip1+/− compound mutant eyes at P0. (B) Retinal tissue (blue) was restored along with a concomitant loss of pigmentation (white) in the retina. The peripheral retina was not rescued to the same extent as the central region. Eye size was also enhanced in the compound mutant (inset). POU4F2 (C) and the amacrine cell marker SOX2 (D) were expressed in the compound mutant. SOX2 is also expressed in RPCs. (E) Expression of Mitf and Otx1 mRNAs were reduced by approximately half in compound mutant retinas (black bars) compared to R227W (white bars) at E12.5. (F) The expression level of D-Mitf mRNA was reduced in compound mutant retinas, whereas H-Mitf mRNA levels were were not significantly different. (G) p27 overexpression in HEK293 cells increased luciferase activity from pGL3B-DMitf, but to a much lesser extent from pGL3B-HMitf. (H) ChIP assays of E12.5 R227W retinal lysates probed with p27 antibody. ChIP panel on left shows products obtained with primer set 1; panel on right shows products obtained with primer set 13. Sequence-verified products denoted by arrowheads. * P≤0.05; ** P≤0.01; *** P≤0.001 Scale bars: 100 µm (B); 1 mm (inset); 50 µm(C,D).
Figure 9
Figure 9. Molecular interactions between the VSX2 variants and components of the pigmentation circuitry.
(A) p27 mRNA expression in E12.5 retinas of the indicated genotypes as determined by qRT-PCR. Samples were normalized to orJ. Only the R227W retina was significantly different. (B) Luciferase activities from HEK293 cells transfected with the indicated expression vectors (x-axes) and ∼1.1 kb of the p27 promoter region (pGL3B-p27). Graph I: H-MITF repressed reporter activity in a DNA binding-dependent manner. Graph II: VSX2 and VSX2[R227W] enhanced reporter activity. Graph III: H-MITF combined with VSX2[R227W] elicited a specific and synergistic increase in reporter activity that depended on DNA binding as revealed by the abrogated activity of the VSX2[R200Q, R227W] double mutant (RQRW). Graph IV: Expression of the mi version of H-MITF had no effect on reporter activity resulting from VSX2 or its variants. (C) Schematic of p27 5′-intergenic region (∼1.1 kb). Positions of putative Mitf binding sites (M) and homeodomain core sequences (H) are shown. Positions are relative to p27 transcriptional start site. Position of primers that constitute p27 primer set 2 (Table S1) is also shown. Graphs show quantification of ChIP-qPCR assays using MITF or VSX2 antibodies reacted with E12.5 lysates from wild-type, R200Q and R227W retinas. MITF binding was detected in R200Q and R227W lysates. VSX2 binding was detected in R227W lysate. (D) Co-IPs of E12.5 R227W and R200Q retinal protein lysates with a negative control sheep IgG or VSX2 antibodies followed by western blot probed with MITF antibody (top panel). Co-IPs of HEK293 cells transfected with VSX2 or its variants (listed below images) plus H-MITF (middle panel) or its mi variant (bottom panel). IPs were performed with sheep IgG or VSX2 antibodies followed by western blot probed with MITF antibody. input refers to the 20% of whole protein lysate used for co-IP. (E) Luciferase assays in HEK293 cells transfected with the indicated expression vectors (x-axes) and the pGL3B-HMitf. Left graph: effects of VSX2 and its variants on reporter activity were not statistically significant. Right graph: H-MITF repressed reporter activity, whereas OTX1 enhanced reporter activity. Reporter activity in cells co-expressing of OTX1 and H-MITF was significantly higher than the sum of the factors expressed individually (** associated with lines over bars). H-MITF[mi] enhanced reporter activity, but reporter activity in cells co-expressing OTX1 and H- MITF[mi] was not significantly different than the sum of the two factors expressed individually. * P≤0.05; ** P≤0.01; *** P≤0.001.
Figure 10
Figure 10. Regulation of pigmentation programs in wild-type and mutant RPCs.
(A) During early eye development, Mitf is expressed in optic neuroepithelial cells (MitfONC) in response to upstream activators. Vsx2 expression is activated in the newly specified retinal domain by upstream activators, which leads to repression of Mitf in RPCs (MitfRPC) and suppression of the pigmentation program. (B) In orJ mice, Mitf persists in RPCs because the VSX2 protein is absent, which increases the probability that pigmentation will occur. (C) In R200Q mice, VSX2[R200Q] protein is present but unable to bind DNA, allowing Mitf to persist in RPCs, increasing the probability of pigmentation. (D) In R227W mice, VSX2[R227W] protein is present and may still suppress the pathway that leads to pigmentation in orJ and R200Q RPCs, but its interaction with Mitf combined with its weak DNA binding activity engages a novel positive feedback loop that activates a robust pigmentation program. Our genetic data place Otx1 downstream of p27 and D-Mitf, but the mechanism causing its elevated expression is not clear.
Figure 11
Figure 11. Models of Mitf regulation in RPCs during normal retinal development.
(A) In response to RPC program activators, Vsx2 expression is initiated and newly produced protein interacts with preexisting MITF protein, preventing access to targets required for the pigmentation program. (B) Once VSX2 protein expression is established, it regulates Mitf activity by directly repressing Mitf transcription of isoforms such as D-Mitf and binds to MITF proteins produced from promoters that Vsx2 does not efficiently repress such as A-Mitf and possibly H-Mitf.

Similar articles

Cited by

References

    1. Vaquerizas JM, Kummerfeld SK, Teichmann SA, Luscombe NM (2009) A census of human transcription factors: function, expression and evolution. Nat Rev Genet 10: 252–263. - PubMed
    1. Fraenkel E, Pabo CO (1998) Comparison of X-ray and NMR structures for the Antennapedia homeodomain-DNA complex. Nat Struct Biol 5: 692–697. - PubMed
    1. Chi YI (2005) Homeodomain revisited: a lesson from disease-causing mutations. Hum Genet 116: 433–444. - PMC - PubMed
    1. Affolter M, Slattery M, Mann RS (2008) A lexicon for homeodomain-DNA recognition. Cell 133: 1133–1135. - PubMed
    1. Berger MF, Badis G, Gehrke AR, Talukder S, Philippakis AA, et al. (2008) Variation in homeodomain DNA binding revealed by high-resolution analysis of sequence preferences. Cell 133: 1266–1276. - PMC - PubMed

Publication types

MeSH terms