. 2012 Sep;8(9):e1002985.
doi: 10.1371/journal.pgen.1002985. Epub 2012 Sep 20.

Factors that promote H3 chromatin integrity during transcription prevent promiscuous deposition of CENP-A(Cnp1) in fission yeast

Affiliations

Factors that promote H3 chromatin integrity during transcription prevent promiscuous deposition of CENP-A(Cnp1) in fission yeast

Eun Shik Choi et al. PLoS Genet. 2012 Sep.

Abstract

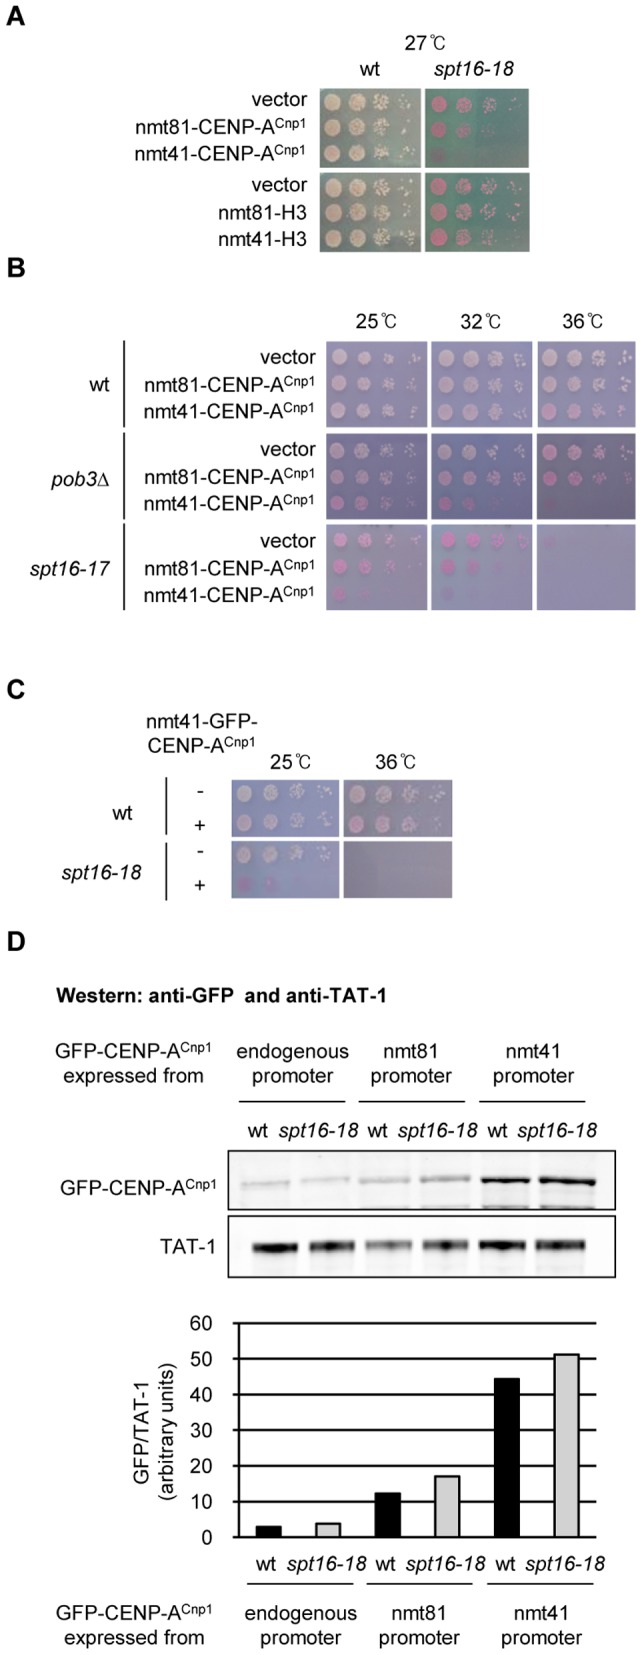
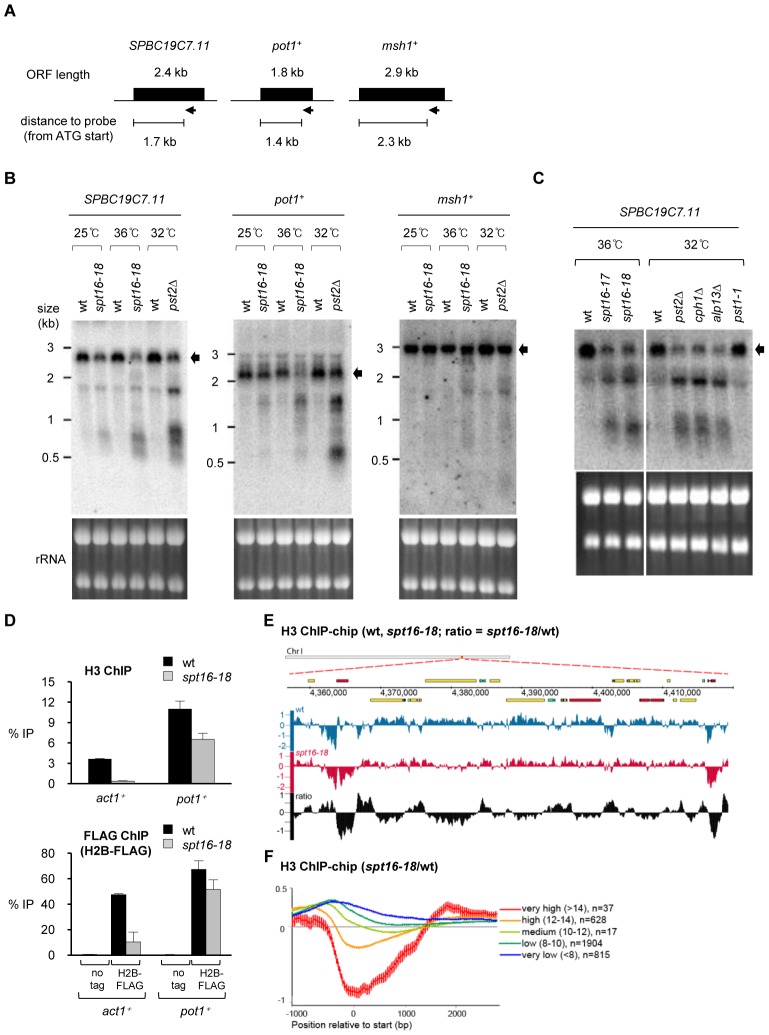
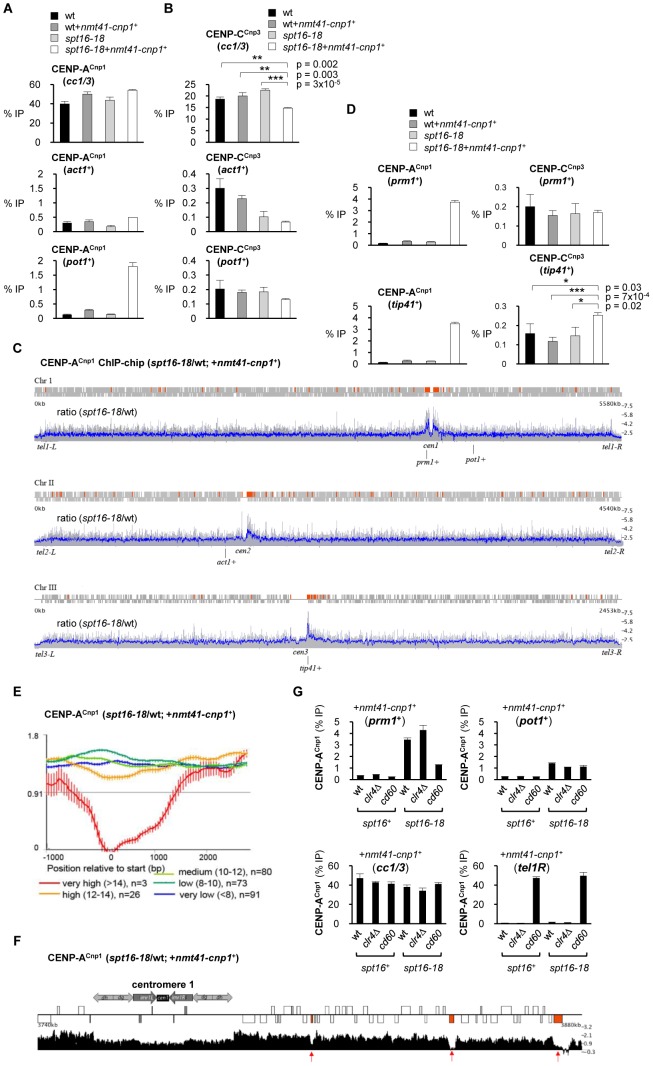
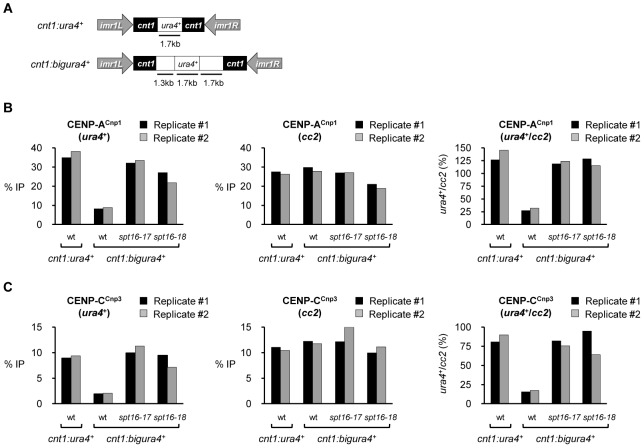
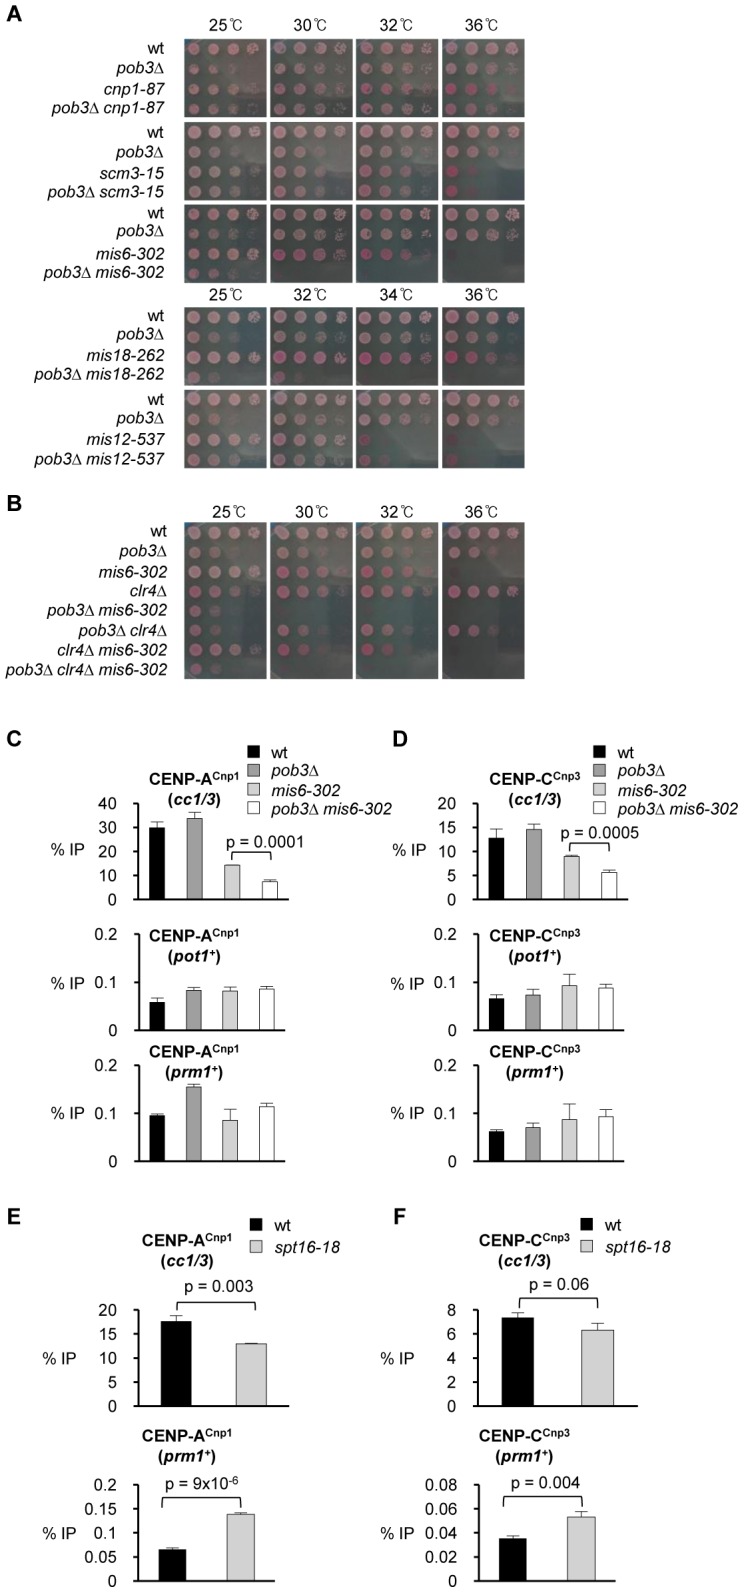
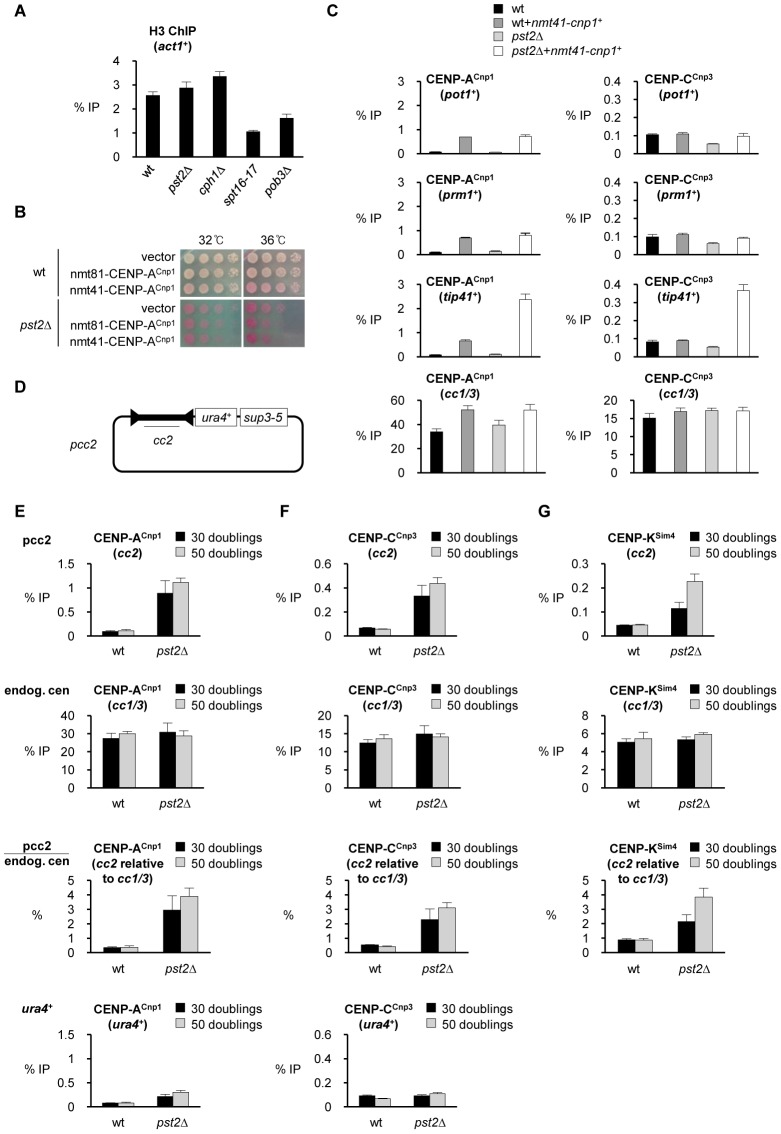
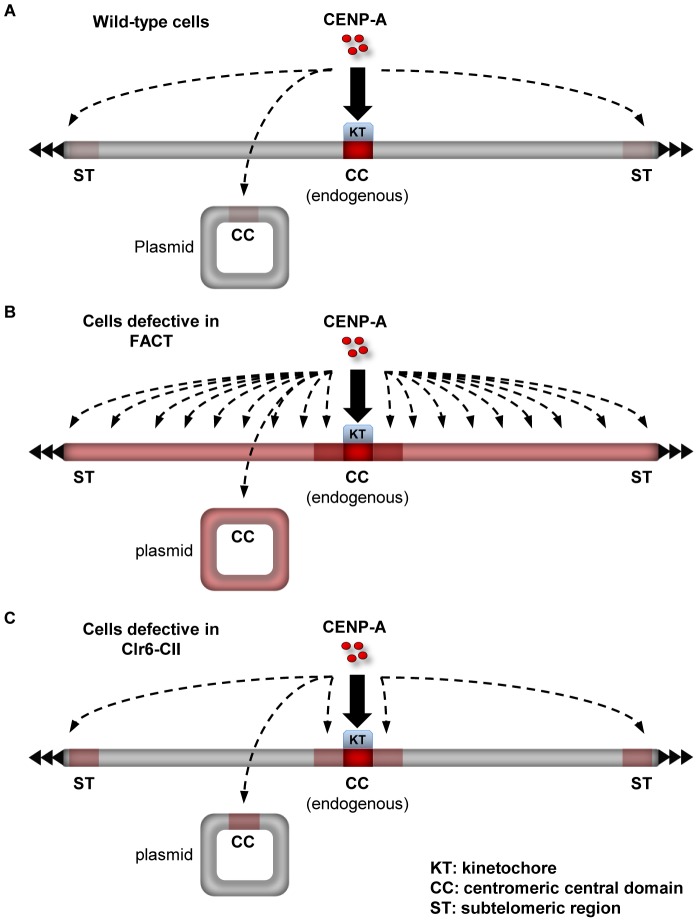
Specialized chromatin containing CENP-A nucleosomes instead of H3 nucleosomes is found at all centromeres. However, the mechanisms that specify the locations at which CENP-A chromatin is assembled remain elusive in organisms with regional, epigenetically regulated centromeres. It is known that normal centromeric DNA is transcribed in several systems including the fission yeast, Schizosaccharomyces pombe. Here, we show that factors which preserve stable histone H3 chromatin during transcription also play a role in preventing promiscuous CENP-A(Cnp1) deposition in fission yeast. Mutations in the histone chaperone FACT impair the maintenance of H3 chromatin on transcribed regions and promote widespread CENP-A(Cnp1) incorporation at non-centromeric sites. FACT has little or no effect on CENP-A(Cnp1) assembly at endogenous centromeres where CENP-A(Cnp1) is normally assembled. In contrast, Clr6 complex II (Clr6-CII; equivalent to Rpd3S) histone deacetylase function has a more subtle impact on the stability of transcribed H3 chromatin and acts to prevent the ectopic accumulation of CENP-A(Cnp1) at specific loci, including subtelomeric regions, where CENP-A(Cnp1) is preferentially assembled. Moreover, defective Clr6-CII function allows the de novo assembly of CENP-A(Cnp1) chromatin on centromeric DNA, bypassing the normal requirement for heterochromatin. Thus, our analyses show that alterations in the process of chromatin assembly during transcription can destabilize H3 nucleosomes and thereby allow CENP-A(Cnp1) to assemble in its place. We propose that normal centromeres provide a specific chromatin context that limits reassembly of H3 chromatin during transcription and thereby promotes the establishment of CENP-A(Cnp1) chromatin and associated kinetochores. These findings have important implications for genetic and epigenetic processes involved in centromere specification.


Conflict of interest statement

The authors have declared that no competing interests exist.

Figures

Figure 1
Figure 1. Overexpression of CENP-ACnp1 causes toxicity in FACT mutants.
(A) Viability of wild-type (wt) and spt16-18 cells expressing additional CENP-ACnp1 or H3 at low (nmt81-CENP-ACnp1, nmt81-H3) or medium (nmt41-CENP-ACnp1, nmt41-H3) levels compared to empty vector. Cells were grown at 27°C which is semi-permissive for spt16-18. Phloxine B plates stain dead cells red. (B) Viability of wt, pob3Δ and spt16-17 cells expressing additional CENP-ACnp1 at low (nmt81-CENP-ACnp1) or medium (nmt41-CENP-ACnp1) levels compared to empty vector at indicated temperatures. (C) Viability of wt and spt16-18 cells expressing GFP-CENP-ACnp1 from integrated pREP41-GFP-cnp1 + (nmt41-GFP-CENP-Acnp1) compared to no GFP-CENP-ACnp1 control. (D) Western analysis of GFP-CENP-ACnp1 levels in wt and spt16-18 cells expressing GFP-CENP-ACnp1 under endogenous, nmt81 or nmt41 promoter (upper panel). The intensities of GFP-CENP-ACnp1 and TAT-1 (alpha-tubulin) signals were measured using LICOR Odyssey Infrared Imaging System software (Li-COR Bioscience) and the relative intensities of GFP-CENP-ACnp1/TAT-1 were quantified (bottom panel). GFP-CENP-ACnp1 was expressed for 24 h at 25°C before harvest.
Figure 2
Figure 2. Spt16 is required to suppress cryptic transcription initiation and nucleosome loss at RNAPII genes.
(A) Schematic of genes and positions of RNA probes (arrow) used in Northern analysis. (B) Northern analyses of transcripts from SPBC19C7.11, pot1 + and msh1 + genes. RNA was extracted from cells grown at 25°C (wt, spt16-18), 32°C for 6 h (wt, pst2Δ) or 36°C for 1 h (wt, spt16-18) after shift from 25°C. Arrow indicates full-length transcripts. (C) Northern analysis of transcripts from SPBC19C7.11. Cells were grown at 36°C for 2 h after shift from 25°C (wt, spt16-ts) or at 32°C for 6 h after shift from 25°C (wt, pst2Δ, cph1Δ, alp13Δ, pst1-1), as indicated. (D) ChIP analysis of H3 levels at act1 + and pot1 + in wt and spt16-18 cells grown at 36°C for 1 h after shift from 25°C (top). ChIP analysis of H2B levels at act1 + and pot1 + in wt and spt16-18 cells expressing H2B-FLAG or untagged H2B (bottom). Enrichment is reported as % IP. Error bar indicates S.D. from 3 biological replicates. (E) Genome browser view showing ChIP-chip occupancy profiles for H3 in wt (blue) and spt16-18 cells (red). The relative ratio (spt16-18/wt) is indicated in black. Data on the Y-axis are presented in log2 scale and the X-axis shows genome positions in base pairs. Open reading frames (ORFs) are displayed as boxes and colored according to transcription levels (highly transcribed genes in red, medium transcribed genes in green and low transcribed genes in blue). (F) Average gene analysis for the ratio of H3 occupancy in spt16-18 mutants versus wt. Genes are aligned at transcription start site and divided into four groups dependent of their transcription levels. Data on the Y-axis are presented in log2 scale and the X-axis shows position relative to start (bp). Values for gene expression were calculated using Podbat based on the RNA data from a previous study , . The gene expression value ranged between 5 and 15, and genes were assigned into categories based on this value. Five categories were made: very high (>14) (n = 37), high (12–14) (n = 591), medium (10–12) (n = 1726), low (8–10) (n = 1904) and very low (<8) (n = 815). n = number of genes in each group. Error bars represent 99% confidence intervals.
Figure 3
Figure 3. Spt16 prevents promiscuous incorporation of CENP-ACnp1.
(A) ChIP analysis of CENP-ACnp1 levels at endogenous centromeres (cc1/3), act1 + and pot1 + in wt and spt16-18 cells in the absence or presence of OE-CENP-ACnp1 (nmt41-cnp1 +; pREP41-cnp1 + integrated at ars1 locus). Cells were grown at 36°C for 1 h after shift from 25°C. (B) ChIP analysis of CENP-CCnp3 in the same samples. (C) ChIP-chip: relative CENP-ACnp1 levels in spt16-18 cells compared to wt. ORFs are displayed as grey boxes. Regions of at least 1 kb in length and with >2-fold increase in CENP-ACnp1 signal above genome-wide average are colored red. Data on the Y-axis are presented in linear scale. Blue: running average signal/100 probes. Grey: signal for individual probes. (D) ChIP analyses of CENP-ACnp1 and CENP-CCnp3 levels at prm1 + and tip41 +. Error bars indicate S.D. from 3 biological replicates. (E) Average gene analysis for the ratio of CENP-ACnp1 occupancy in spt16-18 versus wt cells (with OE-CENP-ACnp1). Genes within 100 kb of centromeres were selected and divided into four groups dependent of their relative transcription levels and aligned at their transcriptional start sites. Data on the Y-axis are presented in log2 scale and the X-axis shows position relative to start (bp). Values for gene expression were calculated using Podbat based on the RNA data from a previous study , . The gene expression value ranged between 5 and 15, and genes were assigned into categories based on this value. Five categories were made: very high (>14) (n = 37), high (12–14) (n = 591), medium (10–12) (n = 1726), low (8–10)(n = 1904) and very low (<8) (n = 815). n = number of genes in each group. Error bars represent 99% confidence intervals. (F) Genome browser view showing relative enrichment of CENP-ACnp1 at cen1-proximal regions (spt16-18/wt; with OE-CENP-ACnp1). Data on the Y-axis are presented in linear scale. Boxes are ORFs; red: genes with very high expression levels. (G) ChIP analysis of CENP-ACnp1 levels at prm1 +, pot1 +, endogenous centromeres (cc1/3) and a neocentromere region (tel1R) in wt, clr4Δ and cd60 (neocentromere strain; cen1 DNA deleted) cells containing either spt16 + or spt16-18 allele and all with OE-CENP-ACnp1 (nmt41-cnp1 +). Note: centromere primers (cc1/3) detect both cen1 and cen3 and thus CENP-ACnp1 enrichment at cc1/3 in cd60 represents CENP-ACnp1 levels at cen3 only. In all ChIP analyses, enrichment is reported as % IP.
Figure 4
Figure 4. Spt16 prevents efficient assembly of CENP-ACnp1 chromatin on large non-centromeric DNA inserted within the central domain.
(A) Schematic of cnt1:ura4 + and cnt1:bigura4 +. (B) ChIP analysis of CENP-ACnp1 at ura4 + and endogenous centromere (cc2) in the indicated strains. ura4 +/cc2: relative enrichment of CENP-ACnp1 at ura4 + compared to cc2. Cells were grown at 36°C for 1 h after shift from 25°C. (C) ChIP analysis of CENP-CCnp3 in the same samples. Data for two biological replicates (#1 and #2) are presented. Enrichment is reported as % IP.
Figure 5
Figure 5. Pob3 genetically interacts with Mis6 and Mis18 and is required to maintain CENP-ACnp1 at endogenous centromeres in mis6-302 cells.
(A) Viability of cells bearing pob3Δ combined with mutants affecting centromere function (cnp1-87, scm3-15, mis6-302 and mis12-537) relative to wt cells and single mutants. Cells were spotted on plates containing Phloxine B at indicated temperatures. (B) Viability of wt and mutant cells bearing a combination of mutations in Pob3, Mis6 and Clr4 (pob3Δ, mis6-302, clr4Δ, pob3Δ mis6-302, pob3Δ clr4Δ, clr4Δ mis6-302 and pob3Δ clr4Δ mis6-302). (C) ChIP analysis of CENP-ACnp1 at endogenous centromeres (cc1/3), pot1 + and prm1 + in the indicated strains. Cells were grown at 25°C, shifted to 30°C for 17 h after shift from 25°C. (D) ChIP analysis of CENP-CCnp3 in the same samples. (E) ChIP analysis of CENP-ACnp1 levels at endogenous centromeres (cc1/3) and prm1 + in wt and spt16-18 cells grown at 27°C (semi-permissive for spt16-18) for 24 h. (F) ChIP analysis of CENP-CCnp3 in the same samples. Enrichment is reported as % IP. Error bars indicate S.D. from 3 biological replicates.
Figure 6
Figure 6. Loss of Clr6-CII function promotes assembly of CENP-ACnp1 chromatin at specific loci.
(A) ChIP analysis of H3 levels at act1 + in the indicated strains grown at 32°C. Note: spt16-17 (but not spt16-18) cells are viable at 32°C and thus are grown in parallel with other mutants as a positive control in this experiment. (B) Viability of wt and pst2Δ cells expressing additional CENP-ACnp1 at low (nmt81-CENP-ACnp1) or medium (nmt41-CENP-ACnp1) levels compared to empty vector at 32°C and 36°C. (C) ChIP analyses of CENP-ACnp1 and CENP-CCnp3 levels in wt and pst2Δ cells at pot1 +, prm1 +, tip41 + and endogenous centromeres (cc1/3). Cells were grown at 32°C. (D) Schematic of pcc2 plasmid. pcc2 plasmid contains 8.6 kb cen2 central domain (cc2), ura4 + and sup3-5. (E) ChIP analysis of CENP-ACnp1 levels at cc2 in pcc2 plasmid and at endogenous centromere (cc1/3) in wt and pst2Δ cells carrying pcc2. The relative enrichment of CENP-ACnp1 at cc2 compared to endogenous centromere (cc1/3) is presented (cc2 relative to cc1/3). Enrichment of CENP-ACnp1 at ura4 + in pcc2 is also measured. (F) ChIP analysis of CENP-CCnp3 levels in the same samples. (G) ChIP analysis of Sim4 levels in the same samples. ChIP was performed after 30 and 50 cell doublings at 32°C from the introduction of pcc2. Enrichment is reported as % IP. Error bars indicate S.D. from at least 3 biological replicates.
Figure 7
Figure 7. Summary on the role of factors that promote the integrity of H3 chromatin during transcription in preventing promiscuous CENP-ACnp1 deposition.
(A) In wild-type cells, a limited amount of free CENP-ACnp1 is available to accumulate outside endogenous centromeres at which kinetochore proteins act to attract CENP-ACnp1. This limited pool of free CENP-ACnp1 can be preferentially deposited to specific sites such as centromeric central domain (CC) and subtelomeric regions (ST). Intensity of red color on the chromosome and the plasmid represents relative “receptiveness” of the locus for CENP-ACnp1 incorporation. Bold arrow indicates regions where CENP-ACnp1 incorporation normally occurs without overexpression (i.e. centromeres). Dashed arrows indicate regions where de novo assembly of CENP-ACnp1 is expected under conditions where CENP-ACnp1 deposition is stimulated (e.g. when CENP-ACnp1 is overexpressed or flanking heterochromatin is provided). (B) In cells with defective FACT, non-centromeric regions become permissive to CENP-ACnp1 (indicated by red color all over the chromosome and the plasmid). Endogenous centromeres drive CENP-ACnp1 assembly at proximal euchromatic regions when they become permissive to CENP-ACnp1 assembly (indicated by dark red color at centromere-proximal regions). CENP-ACnp1 incorporation when overexpressed is not significantly elevated at CC and ST in FACT mutants compared to wild-type cells, suggesting that FACT action may be already limited at these sites. Without CENP-ACnp1 overexpression, the limited pool of free CENP-ACnp1 is distributed to non-centromeric regions and cannot accumulate at normally preferred sites such as CC and ST. (C) In cells with defective Clr6-CII, only specific regions such as centromere-proximal euchromatic regions, CC and ST become permissive to CENP-ACnp1. Clr6-CII has a weaker impact on H3 chromatin compared to FACT and thus loss of Clr6-CII function promotes CENP-ACnp1 incorporation only at regions where CENP-ACnp1 assembly is predisposed (centromere-proximal regions) or FACT action is limited (CC and ST). In Clr6-CII mutants, limited pool of free CENP-ACnp1 is not distributed and can accumulate at preferred sites, allowing de novo assembly of CENP-ACnp1 chromatin on a plasmid bearing CC in the absence of flanking heterochromatin.

Similar articles

Cited by

References

    1. Black BE, Cleveland DW (2011) Epigenetic centromere propagation and the nature of CENP-a nucleosomes. Cell 144: 471–479. - PMC - PubMed
    1. Stimpson KM, Sullivan BA (2010) Epigenomics of centromere assembly and function. Current opinion in cell biology 22: 772–780. - PubMed
    1. Malik HS, Henikoff S (2009) Major evolutionary transitions in centromere complexity. Cell 138: 1067–1082. - PubMed
    1. Marshall OJ, Chueh AC, Wong LH, Choo KH (2008) Neocentromeres: new insights into centromere structure, disease development, and karyotype evolution. American journal of human genetics 82: 261–282. - PMC - PubMed
    1. Allshire RC, Karpen GH (2008) Epigenetic regulation of centromeric chromatin: old dogs, new tricks? Nature reviews Genetics 9: 923–937. - PMC - PubMed

Publication types

MeSH terms