. 2012;7(9):e43056.
doi: 10.1371/journal.pone.0043056. Epub 2012 Sep 18.

Metformin prevents and reverses inflammation in a non-diabetic mouse model of nonalcoholic steatohepatitis

Affiliations

Metformin prevents and reverses inflammation in a non-diabetic mouse model of nonalcoholic steatohepatitis

Yuki Kita et al. PLoS One. 2012.

Abstract

Background: Optimal treatment for nonalcoholic steatohepatitis (NASH) has not yet been established, particularly for individuals without diabetes. We examined the effects of metformin, commonly used to treat patients with type 2 diabetes, on liver pathology in a non-diabetic NASH mouse model.

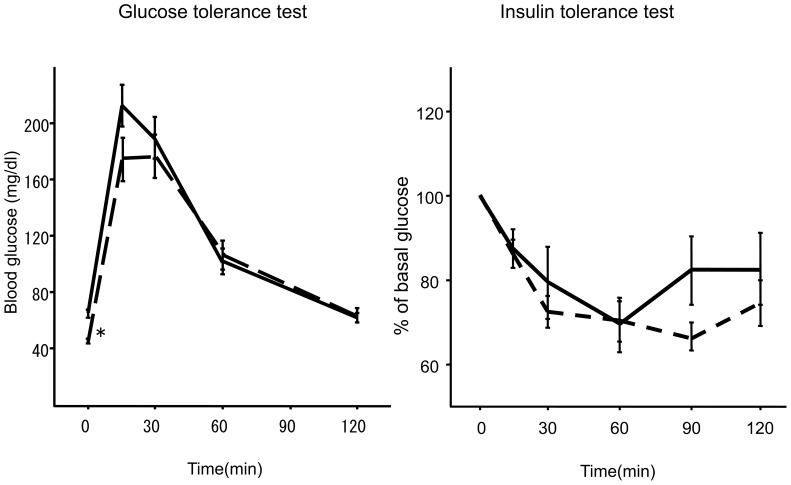
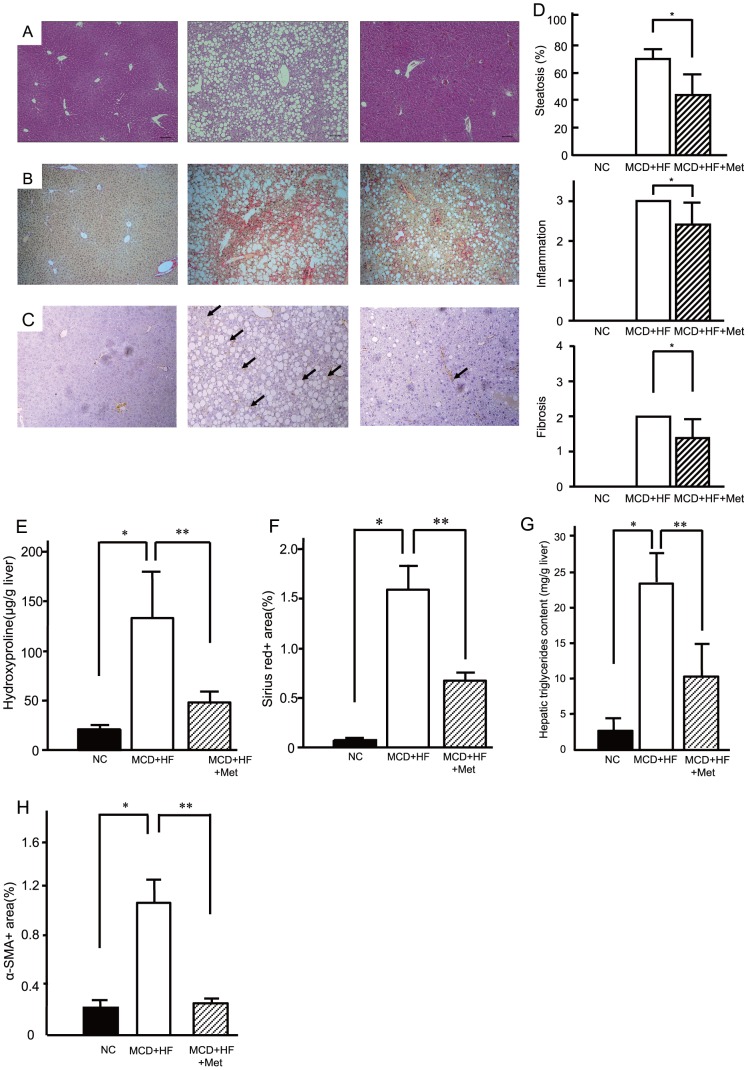
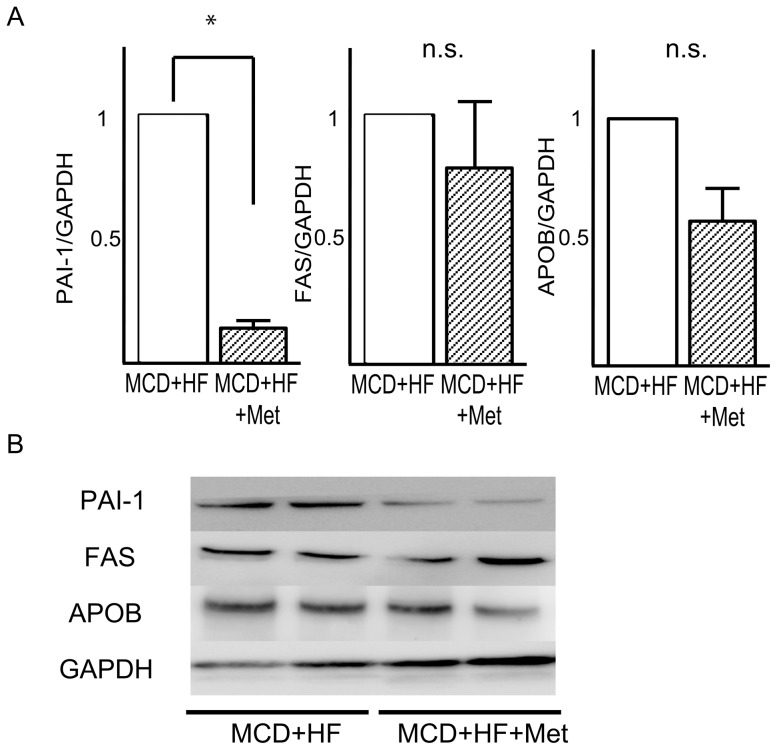
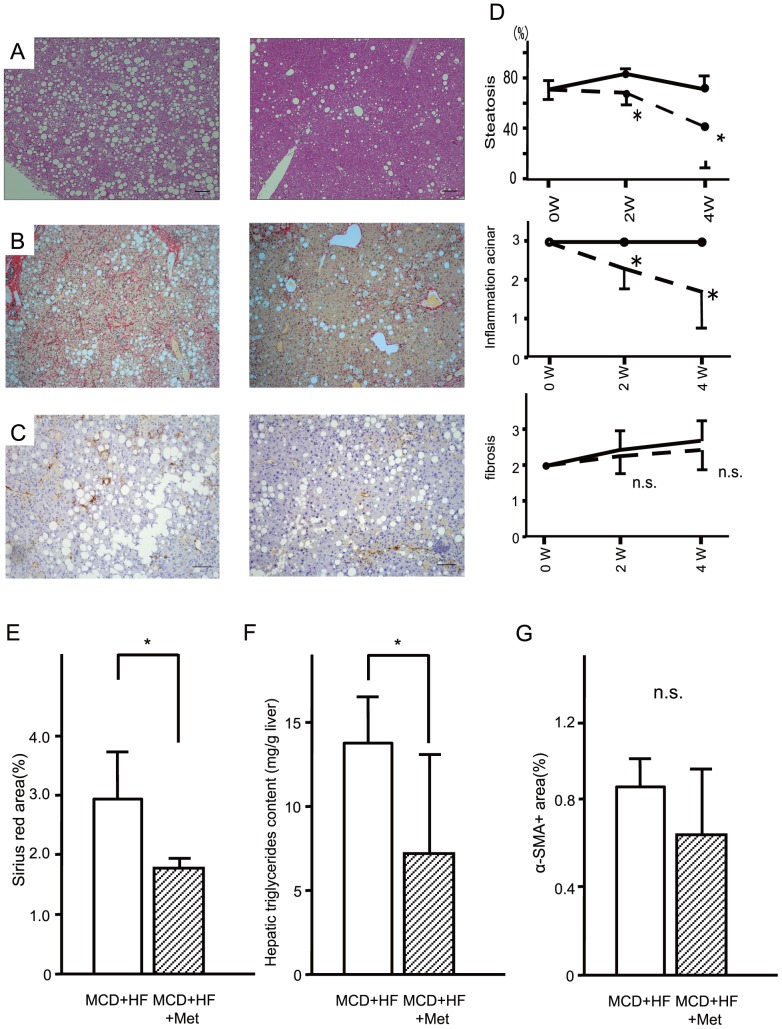
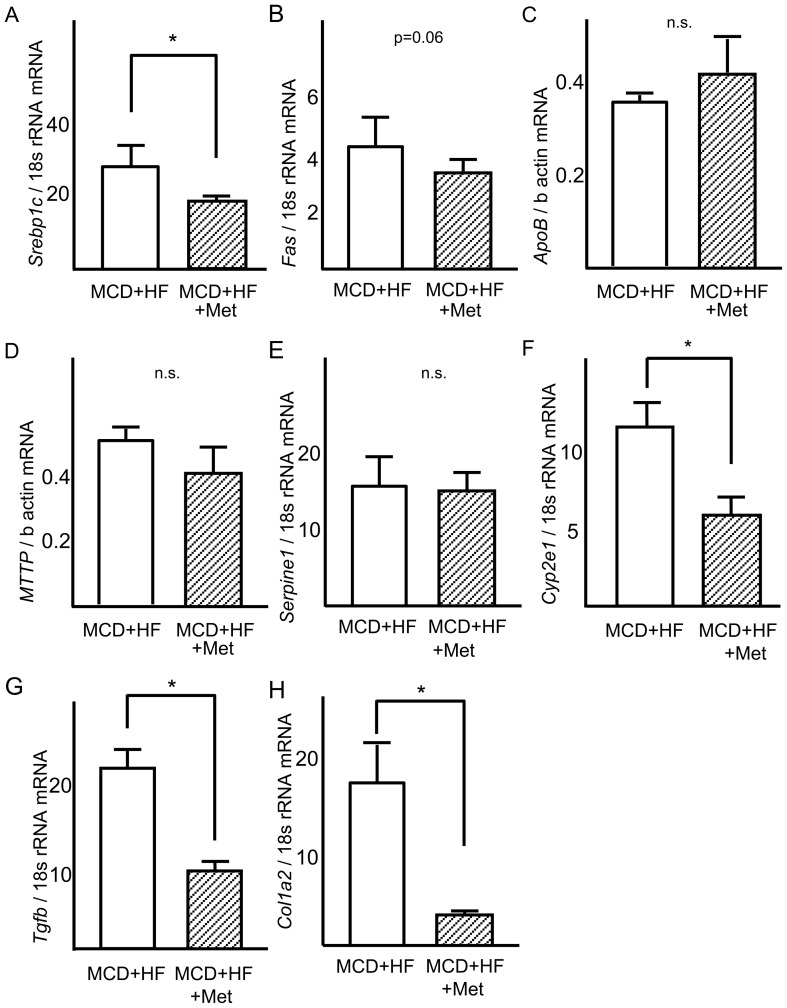
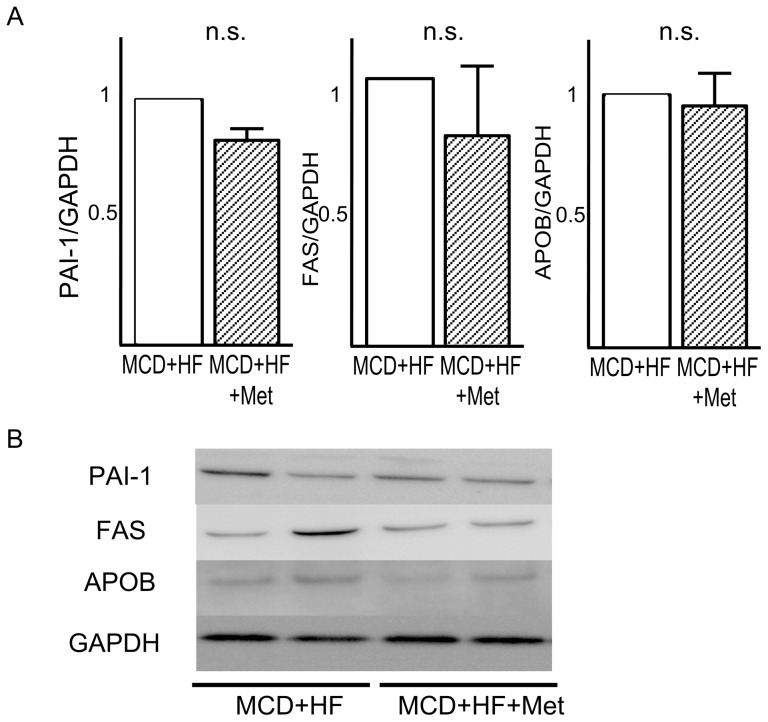
Methodology/principal findings: Eight-week-old C57BL/6 mice were fed a methionine- and choline-deficient plus high fat (MCD+HF) diet with or without 0.1% metformin for 8 weeks. Co-administration of metformin significantly decreased fasting plasma glucose levels, but did not affect glucose tolerance or peripheral insulin sensitivity. Metformin ameliorated MCD+HF diet-induced hepatic steatosis, inflammation, and fibrosis. Furthermore, metformin significantly reversed hepatic steatosis and inflammation when administered after the development of experimental NASH.

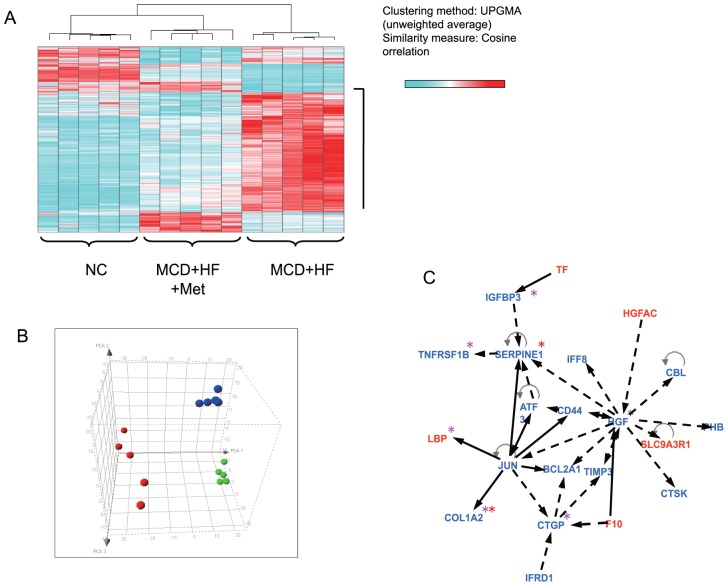
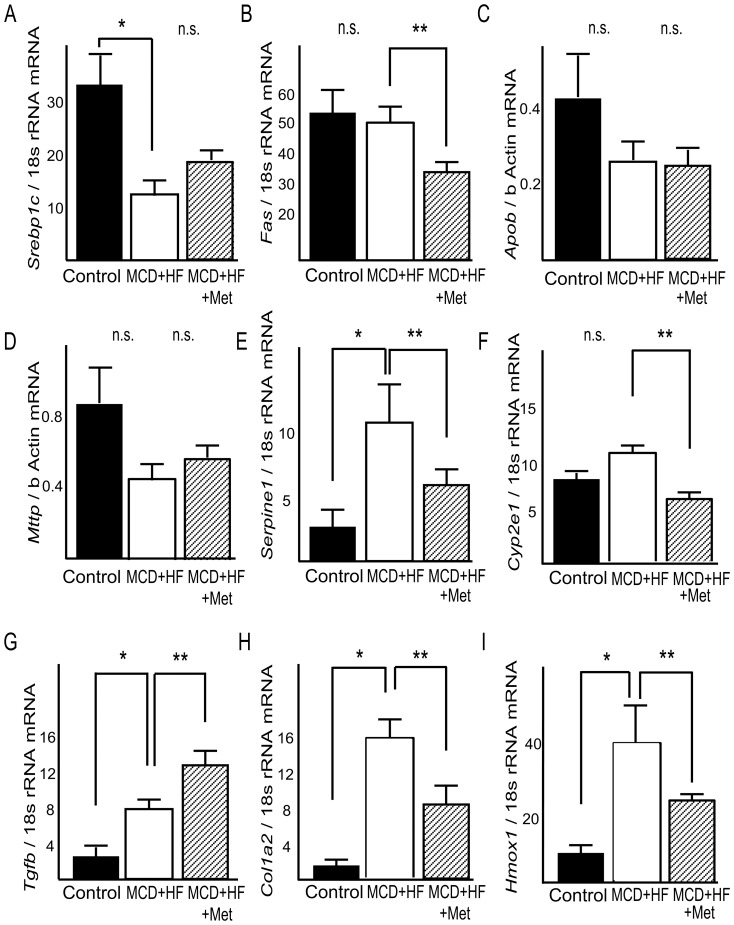
Conclusions/significance: These histological changes were accompanied by reduced hepatic triglyceride content, suppressed hepatic stellate cell activation, and the downregulation of genes involved in fatty acid metabolism, inflammation, and fibrogenesis. Metformin prevented and reversed steatosis and inflammation of NASH in an experimental non-diabetic model without affecting peripheral insulin resistance.


Conflict of interest statement

Competing Interests: Koji Hayashi and Toru Kimura are on the staff of Dainippon Sumitomo Pharma, which deals in metformin. Dainippon Sumitomo Pharma supported the study by materials but has no role in the study design and has no financial interest of the results. There are no patents, products in development or marketed products to declare. This does not alter the authors' adherence to all the PLoS ONE policies on sharing data and materials, as detailed online in the guide for authors.

Figures

Figure 1
Figure 1. Intraperitoneal glucose tolerance test (A) and insulin tolerance test (B).
Black line, methionine- and choline-deficient+high fat diet (MCD+HF, n = 15). Short dashed line, MCD+HF diet mixed with 0.1% metformin (MCD+Met; n = 20). *p<0.05, vs. MCD+HF diet group.
Figure 2
Figure 2. Metformin ameliorated the pathology in a non-alcoholic steatohepatitis dietary model.
Representative photomicrographs show the effects of normal chow (NC, n = 10), the methionine- and choline-deficient+high fat diet (MCD+HF, n = 15), and the MCD+HF diet mixed with 0.1% metformin (MCD+HF+Met; n = 20) on the liver histology in C57BL/6 mice. Mice were fed the diets for 8 weeks. Paraffin-embedded sections were stained with (A) hematoxylin and eosin or (B) sirius red and (C) immunohistochemically stained with anti-α-smooth muscle actin. Bar, 20 µm. Original magnification, ×100. (D) Blinded observers scored the hematoxylin-and-eosin-stained sections for steatosis and inflammation severity; azan-stained samples were scored for fibrosis. The scoring criteria are described in the Materials and Methods. Values are means ± standard error of the mean. *p<0.05, vs. MCD+HF diet group. (E) Hepatic hydroxyproline (F) morphometric analysis of liver fibrosis of sirius red stain (G) Metformin improved hepatic triglyceride content in diet-induced non-alcoholic steatohepatitis model mice. (H) Area of α-SMA. Black bar, normal chow (NC, n = 10). White bar, the methionine- and choline-deficient+high fat diet (MCD+HF, n = 15). Mosaic Bar, the MCD diet mixed with 0.1% metformin (MCD+HF+Met; n = 20). Values are the mean ± standard error. *p<0.05, vs. normal chow. **p<0.05, vs. the MCD+HF diet group.
Figure 3
Figure 3. Comprehensive gene expression analyses in livers of mice treated with metformin.
(A) Gene expression profile analysis using materials from individual animals and performed unsupervised hierarchical clustering of all sets of expression data with the 792 genes. The results clearly showed that mice that had been treated with metformin were clustered together with normal chow and could be separated from no treatment. (B) Principal component analysis using the same 792 genes dataset showed a remarkable shift in the distribution of mice treated with metformin compared with no treatment. Green, normal chow group; Red, the methionine- and chorine-deficient (MCD) diet+high fatgroup; Blue, the MCD+HF diet mixed with 0.1% metformin group. (C) Gene-to-gene network analysis was used to investigate molecular relationships between differentially expressed genes included in Hepatic Fibrosis/Hepatic Stellate Cell Activation pathway. Red asterisk (*): NASH related genes. Pink asterisk (*): hepatic fibrosis related genes. Red: genes up-reguleted by metformin treatment. Blue: genes down-regulated by metformin treatment.
Figure 4
Figure 4. Effects of metformin on expression of genes involved in steatosis, inflammation, and fibrosis in the liver of mice fed a MCD+HF diet.
Real-time quantitative polymerase chain reaction was used to measure the hepatic expression of genes encoding (A) sterol regulatory element-binding protein-1c (Srebp1c), (B) fatty acid synthase (Fas), (C) apolipoprotein B (Apob), (D) microsomal triglyceride transfer protein (Mttp), (E) plasminogen activator 1 (Serpine1), (F) cytochrome P450 2e1 (Cyp2e1), (G) transforming growth factor-β (Tgfb), (H) procollagen1a2 (Col1a2), (I) hemeoxigenase1 (Hmox1). Results were normalized against 18S rRNA (Srebp1c, Fas, Serpine1, Cyp2e1, Tgfb, Col1a2, Hmox1) and beta-actin (Apob,Mttp). Values are means ± standard error. *p<0.05, vs. normal chow. **p<0.05, vs. MCD+HF diet group.
Figure 5
Figure 5. Effects of metformin on the levels of proteins involved in lipid metabolism in the liver of mice fed a MCD+HD diet.
(A) Quantitative data from densitometric analysis of Western blots from three samples. (B) Representative blots for PAI-1, FAS, and, APOB are shown. GAPDH is used as a control for protein loading. Values are the mean ± standard error. *p<0.05 versus the MCD+HF diet group.
Figure 6
Figure 6. Metformin reversed steatosis and inflammation of the advanced stages of nonalcoholic steatohepatitis in mice.
Representative photomicrographs show the effects of the methionine- and choline deficient plus high fat diet (MCD+HF, n = 10) and the MCD+HF diet mixed 0.1% metformin (MCD+HF+Met; n = 10). Mice fed the diets for 4 weeks from the advanced stages of steatohepatitis. Paraffin-embedded sections were stained with (A) hematoxylin–eosin, (B) Sirius Red and (C) immunohistochemically stained with anti-α-smooth muscle actin. Bar, 20 µm. Original magnification, ×100. (D) Metformin improved hepatic triglyceride content of diet-induced non-alcoholic steatohepatitis. Mice were fed the methionine- and choline deficient+high fat diet (MCD+HF, n = 10) and the MCD+HF diet mixed 0.1% metformin (MCD+HF+Met; n = 10). Values are the mean ± standard error of the mean. *p<0.05 versus the MCD+HF diet. (E) Morphometric analysis of liver fibrosis of sirius red stain(%). (F) Area of alpha-SMA(%). (G) Metformin improved hepatic triglyceride content of diet-induced non-alcoholic steatohepatitis. White Bar, continuous methionine- and choline deficient+high fat diet (MCD+HF, n = 5). Mosaic Bar, the MCD+HF diet mixed 0.1% metformin (MCD+HF+Met; n = 10). Values are the mean ± standard error. *p<0.05 versus the MCD+HF diet group.
Figure 7
Figure 7. Reverse effects of metformin on expression of genes involved in steatosis, inflammation, and fibrosis in the liver of mice with the advanced stages of nonalcoholic steatohepatitis.
Real-time quantitative polymerase chain reaction was used to measure the hepatic expression of genes encoding (A) sterol regulatory element-binding protein-1c (Srebp1c), (B) fatty acid synthase (Fas), (C) apolipoprotein B (Apob), (D) microsomal triglyceride transfer protein (Mttp), (E) plasminogen activator 1 (Serpine1), (F) cytochrome P450 2e1 (Cyp2e1), (G) transforming growth factor-β (Tgfb), (H) procollagen1a2 (Col1a2). Results were normalized against 18S rRNA (Srebp1c, Fas, Serpine1, Cyp2e1, Tgfb, Col1a2) and beta-actin(Apob,Mttp). Values are means ± standard error. *p<0.05 versus the MCD+HF diet group.
Figure 8
Figure 8. Effects of metformin on the levels of proteins involved in lipid metabolism in the liver of mice with the advanced stages of nonalcoholic steatohepatitis.
(A) Quantitative data from densitometric analysis of Western blots from three samples. (B) Representative blots for PAI-1, FAS, and, APOB are shown. GAPDH is used as a control for protein loading. Values are the mean ± standard error. *p<0.05 versus the MCD+HF diet group.

References

    1. Marchesini G, Brizi M, Morselli-Labate AM, Bianchi G, Bugianesi E, et al. (1999) Association of nonalcoholic fatty liver disease with insulin resistance. Am J Med 107: 450–455. - PubMed
    1. Hamaguchi E, Takamura T, Sakurai M, Mizukoshi E, Zen Y, et al. (2010) Histological course of nonalcoholic fatty liver disease in Japanese patients: tight glycemic control, rather than weight reduction, ameliorates liver fibrosis. Diabetes care 33: 284–286. - PMC - PubMed
    1. Ota T, Takamura T, Kurita S, Matsuzawa N, Kita Y, et al. (2007) Insulin resistance accelerates a dietary rat model of nonalcoholic steatohepatitis. Gastroenterology 132: 282–293. - PubMed
    1. Belfort R, Harrison SA, Brown K, Darland C, Finch J, et al. (2006) A placebo-controlled trial of pioglitazone in subjects with nonalcoholic steatohepatitis. N Engl J Med 355: 2297–2307. - PubMed
    1. Aithal GP, Thomas JA, Kaye PV, Lawson A, Ryder SD, et al. (2008) Randomized, placebo-controlled trial of pioglitazone in nondiabetic subjects with nonalcoholic steatohepatitis. Gastroenterology 135: 1176–1184. - PubMed

Publication types

MeSH terms

Substances