

Temporal percolation of the susceptible network in an epidemic spreading
- PMID: 23028498
- PMCID: PMC3441612
- DOI: 10.1371/journal.pone.0044188
Temporal percolation of the susceptible network in an epidemic spreading
Abstract
In this work, we study the evolution of the susceptible individuals during the spread of an epidemic modeled by the susceptible-infected-recovered (SIR) process spreading on the top of complex networks. Using an edge-based compartmental approach and percolation tools, we find that a time-dependent quantity ΦS(t), namely, the probability that a given neighbor of a node is susceptible at time t, is the control parameter of a node void percolation process involving those nodes on the network not-reached by the disease. We show that there exists a critical time t(c) above which the giant susceptible component is destroyed. As a consequence, in order to preserve a macroscopic connected fraction of the network composed by healthy individuals which guarantee its functionality, any mitigation strategy should be implemented before this critical time t(c). Our theoretical results are confirmed by extensive simulations of the SIR process.
Conflict of interest statement
Figures
 and
and  .
.  as a function of
  (
( ) obtained in Refs. , and
  as a function of
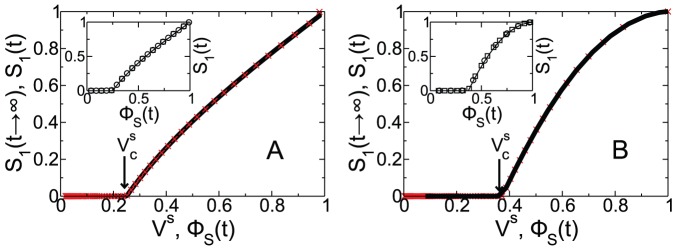
  (solid line) obtained from Eqs. (3)–(2) and (12)–(13) with
  and mean connectivity 4.07 in the giant component for (A) a ER network with
  and (B) SF network with
  ,
,  and
and  . In the insets we show
  as a function of
  from the simulations (symbols) and from Eqs. (3)–(2) and (12)–(13) (solid line) for
  (
( ) and
) and  (
( ). (Color online).
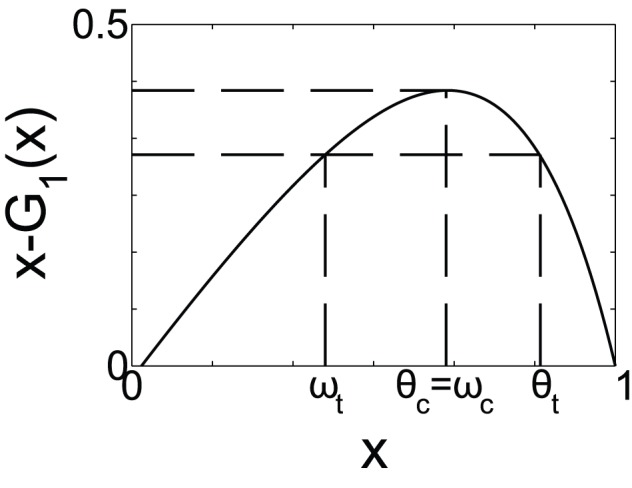
 . From the initial condition
  ,
,  and
and  , satisfies Eq. (12). For
  we have two solutions that correspond to
  . When
  reaches the maximum of the function
  ,
,  , the giant susceptible component is destroyed. The dashed lines are used as a guide to show the possible solutions of Eq. (12).
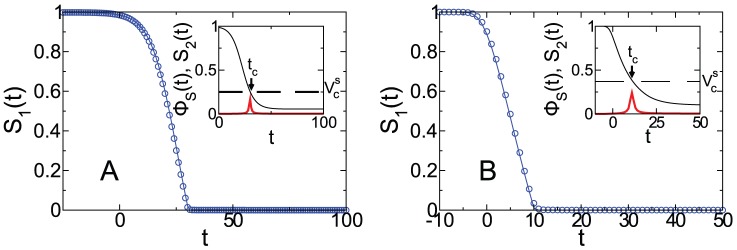
 for
for  and
and  (
( ) and mean connectivity
  in the giant component for (A) a ER network with
  (
( ) and (B) a SF networks with
  , minimal connectivity
  and
and  (
( ). The symbols correspond to the simulations with the time shifted to
  when
when  % of the individuals are infected, and the solid lines correspond to the theoretical solutions
  (blue solid line) of Eqs. (12)–(13). In the insets we show the size of the second biggest susceptible cluster
  (red solid line) and the evolution of
  (black solid line) obtained from simulations. The value of
  (dashed line) was obtained from Eq. (16).
  has been amplified by a factor of 50 in order to show it on the same scale as the rest of the curves. The simulations are averaged over 1000 network realizations with
  . (Color online).
Similar articles
-
Modelling the spread of two successive SIR epidemics on a configuration model network.J Math Biol. 2025 Apr 23;90(5):51. doi: 10.1007/s00285-025-02207-y. J Math Biol. 2025. PMID: 40266328 Free PMC article.
-
Outbreaks in susceptible-infected-removed epidemics with multiple seeds.Phys Rev E. 2016 Mar;93(3):032324. doi: 10.1103/PhysRevE.93.032324. Epub 2016 Mar 30. Phys Rev E. 2016. PMID: 27078383 Free PMC article.
-
Epidemic spreading in annealed directed networks: susceptible-infected-susceptible model and contact process.Phys Rev E Stat Nonlin Soft Matter Phys. 2013 Jan;87(1):012813. doi: 10.1103/PhysRevE.87.012813. Epub 2013 Jan 25. Phys Rev E Stat Nonlin Soft Matter Phys. 2013. PMID: 23410394
-
Finding the probability of infection in an SIR network is NP-Hard.Math Biosci. 2012 Dec;240(2):77-84. doi: 10.1016/j.mbs.2012.07.002. Epub 2012 Jul 20. Math Biosci. 2012. PMID: 22824138 Free PMC article. Review.
-
An overview of epidemic models with phase transitions to absorbing states running on top of complex networks.Chaos. 2021 Jan;31(1):012101. doi: 10.1063/5.0033130. Chaos. 2021. PMID: 33754778 Review.
Cited by
-
Recovery rate affects the effective epidemic threshold with synchronous updating.Chaos. 2016 Jun;26(6):063108. doi: 10.1063/1.4953661. Chaos. 2016. PMID: 27368773 Free PMC article.
-
A primer on the use of probability generating functions in infectious disease modeling.Infect Dis Model. 2018 Sep 25;3:192-248. doi: 10.1016/j.idm.2018.08.001. eCollection 2018. Infect Dis Model. 2018. PMID: 30839899 Free PMC article.
-
Dynamic vaccination in partially overlapped multiplex network.Phys Rev E. 2019 Jan;99(1-1):012302. doi: 10.1103/PhysRevE.99.012302. Phys Rev E. 2019. PMID: 30780375 Free PMC article.
-
A model for the co-evolution of dynamic social networks and infectious disease dynamics.Comput Soc Netw. 2021;8(1):19. doi: 10.1186/s40649-021-00098-9. Epub 2021 Oct 7. Comput Soc Netw. 2021. PMID: 34642614 Free PMC article.
-
Predicting the extinction of Ebola spreading in Liberia due to mitigation strategies.Sci Rep. 2015 Jul 20;5:12172. doi: 10.1038/srep12172. Sci Rep. 2015. PMID: 26190582 Free PMC article.
References
-
- Boccaletti S, Latora V, Moreno Y, Chavez M, Hwang D (2006) Complex networks: Structure and dynamics. Physics Reports 424: 175–308.
-
- Anderson RM, May RM (1992) Infectious Diseases of Humans: Dynamics and Control. Oxford University Press, Oxford.
-
- Lagorio C, Migueles M, Braunstein L, López E, Macri P (2009) Effects of epidemic threshold definition on disease spread statistics. Physica A: Statistical Mechanics and its Applications 388: 755–763.
MeSH terms
LinkOut - more resources
Full Text Sources
Medical
Research Materials
