. 2012;7(9):e44521.
doi: 10.1371/journal.pone.0044521. Epub 2012 Sep 21.

Using networks to understand medical data: the case of Class III malocclusions

Affiliations

Using networks to understand medical data: the case of Class III malocclusions

Antonio Scala et al. PLoS One. 2012.

Abstract

A system of elements that interact or regulate each other can be represented by a mathematical object called a network. While network analysis has been successfully applied to high-throughput biological systems, less has been done regarding their application in more applied fields of medicine; here we show an application based on standard medical diagnostic data. We apply network analysis to Class III malocclusion, one of the most difficult to understand and treat orofacial anomaly. We hypothesize that different interactions of the skeletal components can contribute to pathological disequilibrium; in order to test this hypothesis, we apply network analysis to 532 Class III young female patients. The topology of the Class III malocclusion obtained by network analysis shows a strong co-occurrence of abnormal skeletal features. The pattern of these occurrences influences the vertical and horizontal balance of disharmony in skeletal form and position. Patients with more unbalanced orthodontic phenotypes show preponderance of the pathological skeletal nodes and minor relevance of adaptive dentoalveolar equilibrating nodes. Furthermore, by applying Power Graphs analysis we identify some functional modules among orthodontic nodes. These modules correspond to groups of tightly inter-related features and presumably constitute the key regulators of plasticity and the sites of unbalance of the growing dentofacial Class III system. The data of the present study show that, in their most basic abstraction level, the orofacial characteristics can be represented as graphs using nodes to represent orthodontic characteristics, and edges to represent their various types of interactions. The applications of this mathematical model could improve the interpretation of the quantitative, patient-specific information, and help to better targeting therapy. Last but not least, the methodology we have applied in analyzing orthodontic features can be applied easily to other fields of the medical science.


Conflict of interest statement

Competing Interests: Pietro Auconi and James A. Mcnamara work in a private practice of orthodontics, i.e: Studio Auconi in Rome, Italy, and McNamara Orthodontics, Ann Arbor, Michigan, respectively. There are no patents, products in development or marketed products to declare. This does not alter the authors' adherence to all the PLoS ONE policies on sharing data and materials, as detailed online in the guide for authors.

Figures

Figure 1
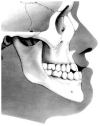
Figure 1. Class III malocclusion with protrusion of the lower dental arch.
Figure 2
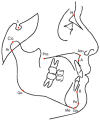
Figure 2. Cephalogram reference points.
Most of the cephalometric landmarks are either angles or normalized linear distances. As an example, SN-GoGn is an angle between anterior cranial base and mandibular plane. The 21 cephalometric landmarks analyzed in the paper correspond to the standard set of features analyzed in orthodontics (see Table 1).
Figure 3
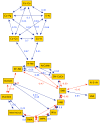
Figure 3. Graph obtained from the cephalometric data of 240 female Class III patients between 7 and 10 years of age (group G1).
The highly connected nodes N-Me (anterior facial height) and SN-GoGn (divergence between the anterior cranial base and mandibular body) work as bridges, i.e. they connect separate sub-graphs. The graph highlights a division between the cephalometric parameters: linear (upper left nodes: Go-Pg, Co-A, S-N, Co-Gn, Co-Gn, N-Me), angular parameters (upper right: PP-PM, SN-Go-Gn, Ar-Go-Me) and adaptive dentoalveolar parameters (lower left: IMPA; FMIA, Interincisal).
Figure 4
Figure 4. Graph obtained from cephalometric data of 90 female Class III patients between 11 years and 12 years of age (group G2).
The graph is composed by two characterized groups: structural (upper group) and dentoalveolar adaptive (lower group of four nodes).
Figure 5
Figure 5. Graph obtained from cephalometric data of 105 female Class III patients between 13 and 14 years of age (group G3).
The main bridge node is S-N-B (longitudinal position of the maxillary arch) divides the structural nodes from the ones representing dentoalveolar adaptive and mixed features.
Figure 6
Figure 6. Graph obtained from cephalometric data of 99 female Class III patients between 15 and 17 years of age (group G4).
The graph is divided into two groups clearly inter-connected via the bridge N-Me (anterior facial height).
Figure 7
Figure 7. Cliques (motifs) individuated by the Power Graphs analysis for female patients (15–17 years) with mild Class III malocclusion (panel A) and with severe Class III malocclusion (panel B).
Mild Class III patients show a single clique of only three structural nodes (SNA, N-S-Ar, PP-SN). Severe Class III patients show the presence of three separate cliques: mandibular sagittal nodes (S-N,…), maxillomandibular divergence nodes (N-Me,…) and adaptive nodes (Wits,..). The comparison between the two figures indicates that severe Class III patients are characterized by the presence of groups of strongly inter-correlated features, i.e. tend to act as a single whole system.

References

    1. Albert R (2007) Network inference, analysis, and modelling in systems biology. The Plant Cell 19: 3327–3338. - PMC - PubMed
    1. Barabàsi A-L, Oltvai ZN (2004) Network biology: under standing the cell's functional organisation. Nat Rev Genet 5: 101–113. - PubMed
    1. Caldarelli G (2007) Scale-free networks. Complex webs in nature and technology. Oxford: Oxford Univ Press.
    1. Newman MEJ (2006) Modularity and community structure in networks. Proc Natl Acad Sci USA 103: 8577–8582. - PMC - PubMed
    1. Barabasi A-L (2009) Scale-free networks: a decade and beyond. Science 325: 412–413. - PubMed