

Time-delayed mutual information of the phase as a measure of functional connectivity
- PMID: 23028571
- PMCID: PMC3445535
- DOI: 10.1371/journal.pone.0044633
Time-delayed mutual information of the phase as a measure of functional connectivity
Abstract
We propose a time-delayed mutual information of the phase for detecting nonlinear synchronization in electrophysiological data such as MEG. Palus already introduced the mutual information as a measure of synchronization. To obtain estimates on small data-sets as reliably as possible, we adopt the numerical implementation as proposed by Kraskov and colleagues. An embedding with a parametric time-delay allows a reconstruction of arbitrary nonstationary connective structures--so-called connectivity patterns--in a wide class of systems such as coupled oscillatory or even purely stochastic driven processes. By using this method we do not need to make any assumptions about coupling directions, delay times, temporal dynamics, nonlinearities or underlying mechanisms. For verifying and refining the methods we generate synthetic data-sets by a mutual amplitude coupled network of Rössler oscillators with an a-priori known connective structure. This network is modified in such a way, that the power-spectrum forms a 1/f power law, which is also observed in electrophysiological recordings. The functional connectivity measure is tested on robustness to additive uncorrelated noise and in discrimination of linear mixed input data. For the latter issue a suitable de-correlation technique is applied. Furthermore, the compatibility to inverse methods for a source reconstruction in MEG such as beamforming techniques is controlled by dedicated dipole simulations. Finally, the method is applied on an experimental MEG recording.
Conflict of interest statement
Figures
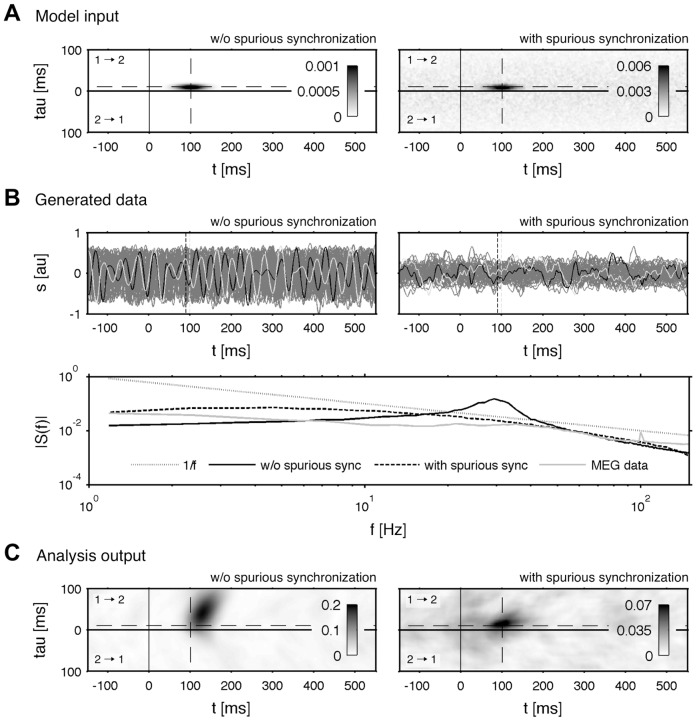
 as the input of Eq.(5) for modeling a connective structure. The pattern on the left is given by a Gaussian in the
  -plane centred at
  ms and
  ms. The pattern on the right includes an additional spurious non-zero background activation (right), which is generated by Gaussian filtered Poisson noise and decays for high time-delays. B Simulated time-series
  with oscillatory (left) and a more stochastic (right) behavior. The maximum of the connectivity is shown via dashed lines: black indicates the driving system and grey the driven system. A comparison of the corresponding power-spectra
  points out a
  characteristic (dotted black line) for the system including a spurious background synchronization (dashed black line), which can be also observed in MEG recordings (grey line). C Corresponding mutual phase information
  for
for  trials. A high connectivity is indicated by a high mutual information. The system featuring a background synchronicity (right) holds a damped, less extended and weaker connectivity in the
  -plane.
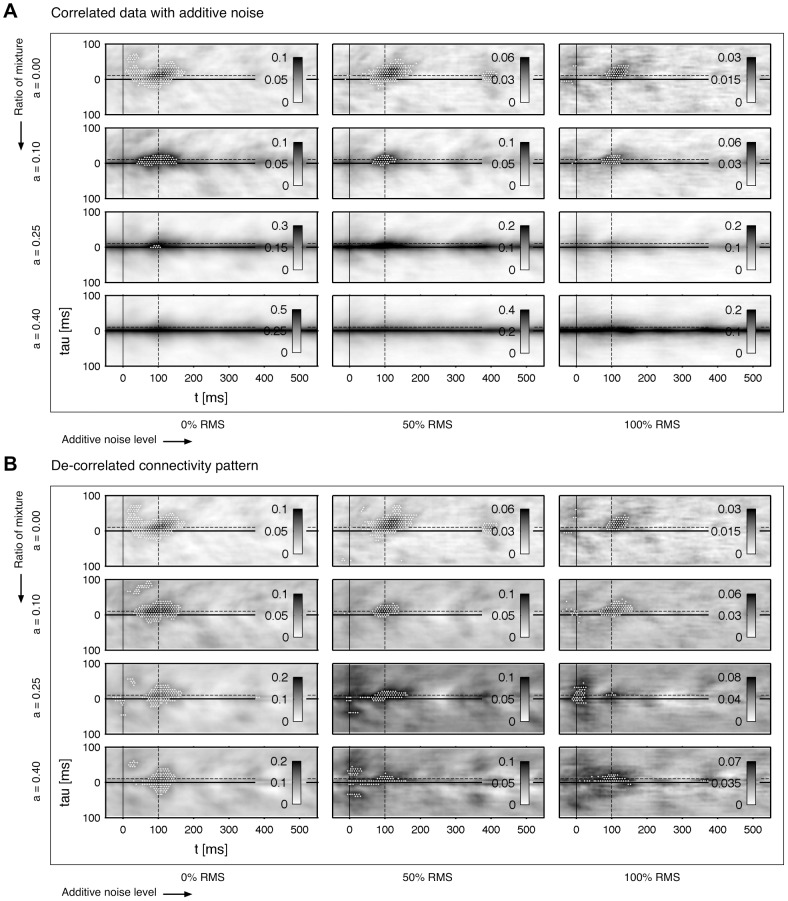
 trials with a
  spectrum, cf. Methods (A modified Rössler network). A
 of two mixed sources. Each pattern represents a connection directed from
  (upper) and
  (lower part). A sliding window
  ms is applied for the estimation. The dashed line indicates the modeled connectivity, cf. Fig. 1A. Parameter
  sets the mixing strength as referred to Eq. (7). In B the pattern is de-correlated by subtracting Eq. (8), which is fitted in the pre-stimulus interval from
  ms to 0 ms. The
  is computed on a triangular grid with a distance of
  between neighbored estimates. Significant increased synchronization is indicated by a white dot on the grid using a FDR with
  .
.
 and an additive noise level of 100 RMS).
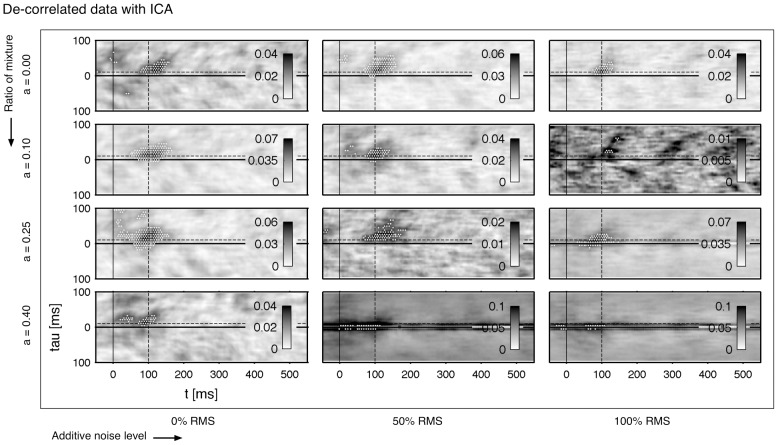
 of the de-mixed sources are shown. The same data-set is used as in Fig. 2A. The computation and statistical validation of
  are performed analogously to the results of Fig. 2A.
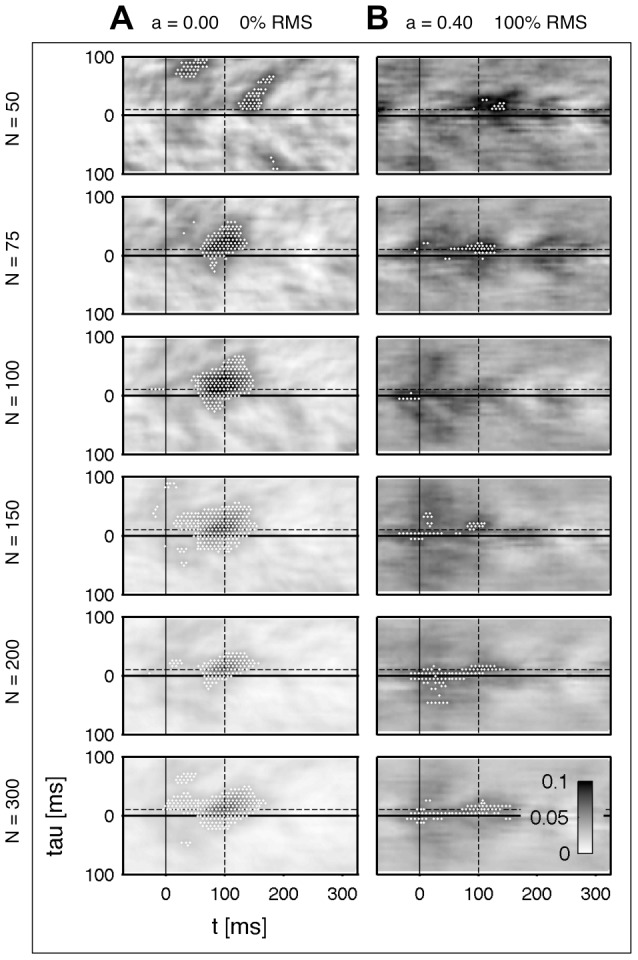
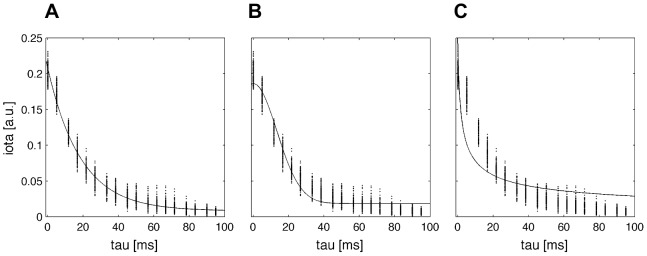
 for a variate number of trials
  . A Two uncorrelated and b) two strongly correlated and noisy sources. The same de-correlation step is applied as in Fig. 2B. The same data-set is used as given in Fig. 2. The black dashed line indicates the center of the modeled connectivity.
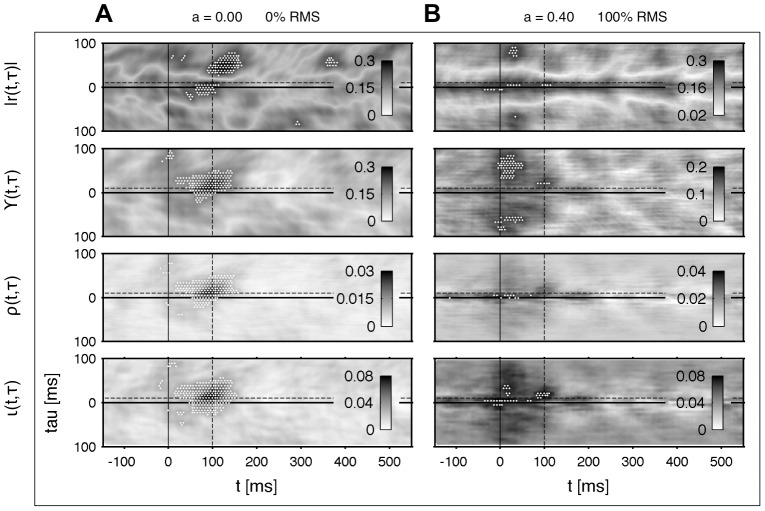
 and without additive uncorrelated white noise, B strong correlated sources with
  and high additive uncorrelated white noise with
  .
.  denotes the absolute value of the cross-correlation of the amplitude.
  is the phase coherence in time-domain, cf. Eq. (9) with
  ,
,  the phase synchronization based on the Shannon-entropy, cf. Eq. (10) with
  , and
, and  the mutual information of the phase, cf. Eq. (4). The same data-set with
  trials is used as shown in Fig. 2A. The connectivity patterns are estimated with a moving time window
  ms and de-correlated analogously to Fig. 2B. The temporal coordinate of the underlying connectivity is indicated by a black dashed line. Because
  ,
,  and
and  are estimated in every bin, the significant increased correlation is indicated by a white area (FDR with
  ).
).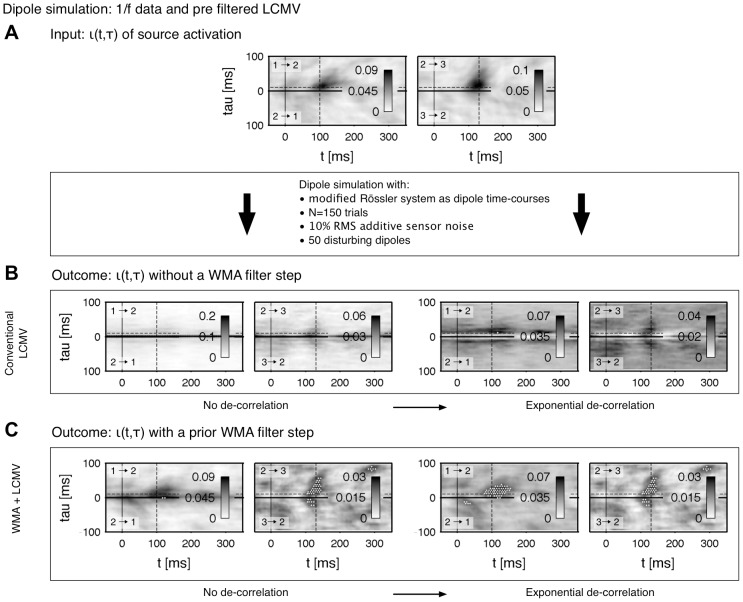
 of the input data. Modified Rössler system with a
  spectrum is used as time-course of three sequentially chained dipoles, cf. Table 1 and 2.
  trials were simulated with an additive uncorrelated sensor noise of
  RMS. Brain noise is adapted by
  uncorrelated, randomly located and orientated dipoles in the grey matter. B Connectivity of the reconstructed source activation with a conventional LCMV beamforming method. C Reconstructed connectivity by applying a weighted LCMV in a preprocessing step: data in sensor space is filtered by a linear weighted moving average in order to suppress thermal noise of the MEG device. The smoothed signals are mapped onto the cortex and the functional connectivity among the reconstructed source activation is estimated. In B and C patterns are unprocessed (left) and processed by an de-correlation on pattern level (right) as suggested in the Results (Pattern de-correlation).
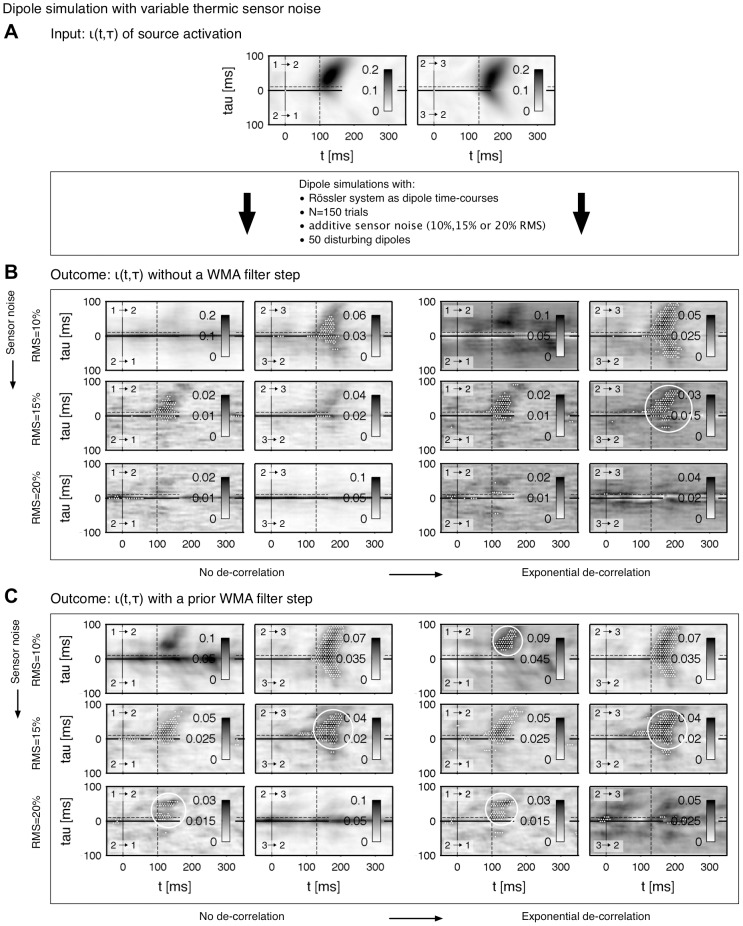
 of the input data (
 trials of a Rössler system), cf. Table 1 and 2. B Connectivity of the reconstructed source activation with a conventional LCMV beamforming. C Reconstructed connectivity by applying a WMA filter on sensor data in a preprocessing step (WMA+LCMV). In B and C the patterns are unprocessed (left) and de-correlated (right) as suggested in the Resutls (Pattern de-correlation). Significant improvements in the connectivity reconstruction compared to the patterns of the conventional beamformer without de-correlation are marked by white solid circles.
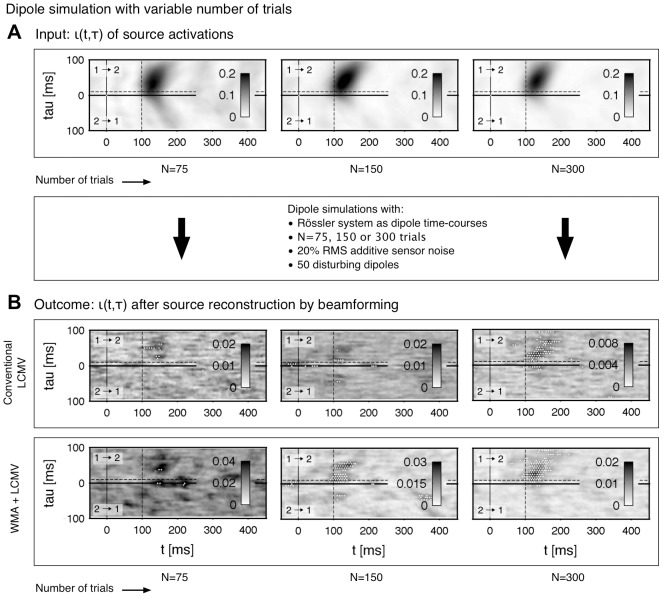
 uncorrelated, randomly located and orientated dipoles in the grey matter. A Connectivity
  of the connected Rössler oscillators indexed with
  and
and  , cf. Table 1 and 2. B Connectivity of the reconstructed source activation with a conventional LCMV beamforming approach. C Reconstructed connectivity by applying a WMA filter to reduce thermal noise captured by the MEG device on sensor data (WMA+LCMV). All patterns in b) and c) are processed by removing exponentially decaying correlations as described in the Results (Pattern de-correlation).
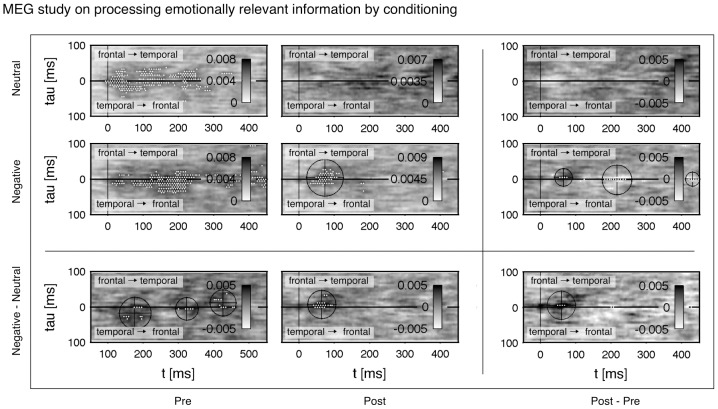
 for 3–150 Hz in terms of the functional connectivity between a temporal and frontal cortical area during a passive viewing of faces with neutral expression. The interval
  –0 ms was taken to estimate a statistical threshold with a FDR ratio of
  . Significant changes are marked by white dots. The patterns were de-correlated with
  . The rows are given by a Negative conditioning with
  and a Neutral control with
  . In the contrast Negative-Neutral the processing of faces is compensated by subtracting the Neutral baseline. The columns denote connectivity before conditioning (Pre), after conditioning (Post) and the contrast Post-Pre, which shows the change in connectivity through the conditioning process. Cluster locations are calculated by the center of gravity and marked by cross hairs. Numerical values of the location are listed in Table 3.
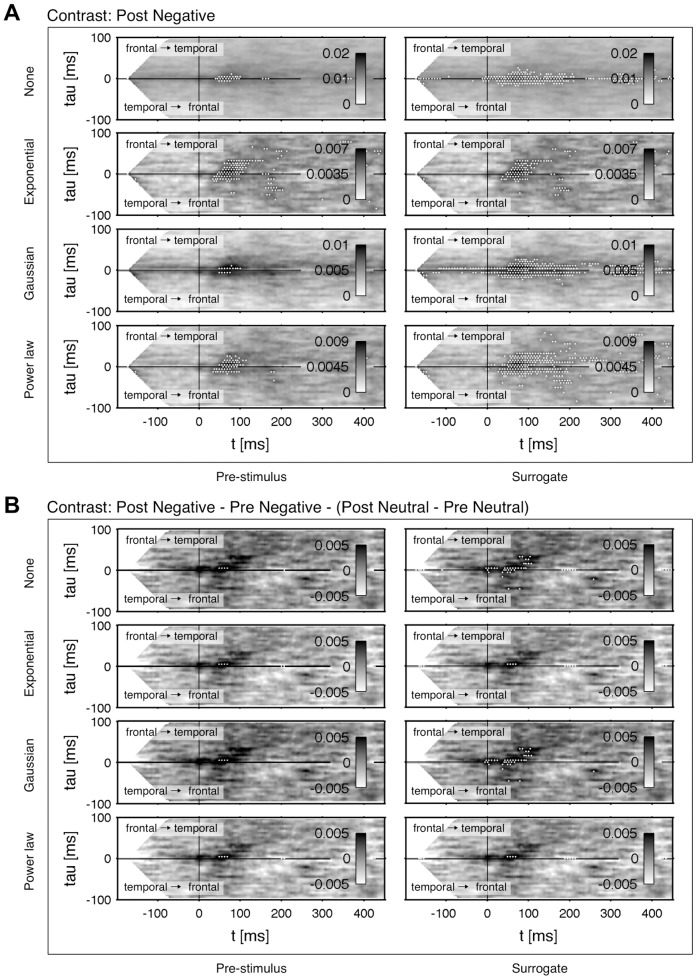
 , Gaussian with
  and Power law with
  . Data from the interval
  –0 ms provides a baseline for the FDR threshold in Pre-Stimulus. As an alternative approach Surrogate data was estimated by destroying correlation in phases. Significant higher connectivities are marked by white dots.
References
-
- Palus M (1997) Detecting phase synchronization in noisy systems. Physics Letters A 235: 341–351.
-
- Kraskov A, Stogbauer H, Grassberger P (2004) Estimating mutual information. Phys Rev E Stat Nonlin Soft Matter Phys 69: 066138 1–16. - PubMed
-
- Pfurtscheller G, da Silva FHL (1999) Event-related EEG/MEG synchronization and desynchronization: basic principles. Clin Neurophysiol 110: 1842–1857. - PubMed
-
- Rodriguez E, George N, Lachaux JP, Martinerie J, Renault B, et al. (1999) Perception's shadow: long-distance synchronization of human brain activity. Nature 397: 430–433. - PubMed
MeSH terms
LinkOut - more resources
Full Text Sources
