. 2012;7(9):e44944.
doi: 10.1371/journal.pone.0044944. Epub 2012 Sep 13.

Different patterns of cytokines and chemokines combined with IFN-γ production reflect Mycobacterium tuberculosis infection and disease

Affiliations

Different patterns of cytokines and chemokines combined with IFN-γ production reflect Mycobacterium tuberculosis infection and disease

Yang Yu et al. PLoS One. 2012.

Abstract

Background: IFN-γ is presently the only soluble immunological marker used to help diagnose latent Mycobacterium tuberculosis (M.tb) infection. However, IFN-γ is not available to distinguish latent from active TB infection. Moreover, extrapulmonary tuberculosis, such as tuberculous pleurisy, cannot be properly diagnosed by IFN-γ release assay. As a result, other disease- or infection-related immunological biomarkers that would be more effective need to be screened and identified.

Methodology: A panel of 41 soluble immunological molecules (17 cytokines and 24 chemokines) was tested using Luminex liquid array-based multiplexed immunoassays. Samples, including plasma and pleural effusions, from healthy donors (HD, n = 12) or patients with latent tuberculosis infection (LTBI, n = 20), pulmonary tuberculosis (TB, n = 12), tuberculous pleurisy (TP, n = 15) or lung cancer (LC, n = 15) were collected and screened for soluble markers. Peripheral blood mononuclear cells (PBMCs) and pleural fluid mononuclear cells (PFMCs) were also isolated to investigate antigen-specific immune factors.

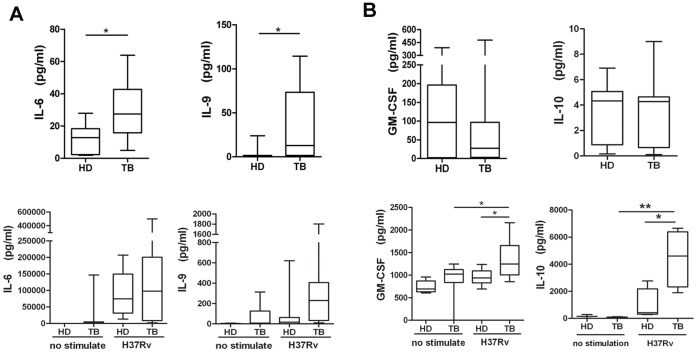
Principal findings: For the 41 examined factors, our results indicated that three patterns were closely associated with infection and disease. (1) Significantly elevated plasma levels of IL-2, IP-10, CXCL11 and CXCL12 were present in both patients with tuberculosis and in a sub-group participant with latent tuberculosis infection who showed a higher level of IFN-γ producing cells by ELISPOT assay compared with other latently infected individuals. (2) IL-6 and IL-9 were only significantly increased in plasma from active TB patients, and the two factors were consistently highly secreted after M.tb antigen stimulation. (3) When patients developed tuberculous pleurisy, CCL1, CCL21 and IL-6 were specifically increased in the pleural effusions. In particular, these three factors were consistently highly secreted by pleural fluid mononuclear cells following M.tb-specific antigen stimulation. In conclusion, our data imply that the specific secretion of soluble immunological factors, in addition to IFN-γ, may be used to evaluate M.tb infection and tuberculosis disease.


Conflict of interest statement

Competing Interests: The authors have declared that no competing interests exist.

Figures

Figure 1
Figure 1. Characterization of cytokine/chemokine expression in LTBI high IFN-γ or low IFN-γ groups. A and B:
The Comparison Index was calculated for each cytokine and chemokine by dividing the concentration of the cytokine/chemokine in the LTBI high IFN-γ (LTB2) or active pulmonary tuberculosis (TB) group by the concentration of the cytokine/chemokine in the LTBI low IFN-γ group (LTB1). LTBI individuals were separated into two groups based on M.tb-specific ELISPOT spot-forming cells counts: lower SFCs counts (LTB1, n = 10, 30–80 SFCs) and higher SFCs counts (LTB2, n = 10, 110–400 SFCs) by M.tb antigen-specific IFN-γ ELISPOT assay (ESAT-6 protein or ESAT-6/CFP-10-derived peptide pools as stimulants). A value greater than 1 indicates that the concentration of the cytokine/chemokine in the LTB2 or TB group was higher than that of LTB1 group. An asterisk indicates that a significant difference was observed between the two groups. “>HD” means both the LTB1 and TB were higher than healthy donor group (HD). C: Expression levels of 4 molecules (IL-2, IP-10, CXCL11 and CXCL12) that differ significantly between the LTB1 and LTB2 groups are shown. Horizontal bars represent median values, boxes represent the interquartile range (25–75%) and whiskers represent the highest and the lowest values. Horizontal lines indicate a statistically significant difference between groups. *p<0.05.
Figure 2
Figure 2. Differences in cytokine/chemokine expression among distinct clinical groups.
A: IL-6, CCL1 and CXCL9 levels in plasma from healthy donors, LTB1 and LTB2 individuals, active TB patients, tuberculous pleurisy patients and lung cancer patients. A red arrow indicates an upward trend. B: Correlation analysis between CXCL11 and CCL21 concentrations in the HD, LTB1, LTB2, TB and TP groups and the IFN-γ ELISPOT SFC values; and the correlation analysis between IL-6 and CCL1 concentrations and IFN-γ plasma concentration. The correlation coefficients were assessed using Pearson’s two-tailed correlation test. C: CCL2, CCL8, IP-10 and CCL11 levels in active pulmonary TB, tuberculous pleurisy and lung cancer patients. Horizontal bars represent median values, boxes represent the interquartile range (25–75%) and whiskers represent the highest and the lowest values. Horizontal lines indicate a statistically significant difference between groups. *p<0.05; **p<0.005.
Figure 3
Figure 3. Comparison of cytokine expression in plasma or in vitro after M.tb antigen-specific stimulation of PBMCs.
A: Data for IL-6 and IL-9 levels in pulmonary tuberculosis patients (TB) and HDs are shown. PBMCs from healthy donors and TB patients were collected for M.tb antigen-specific stimulation in vitro. The IL-6 and IL-9 expression levels in stimulated cell cultures are shown in the panels below. B: GM-CSF and IL-10 levels in plasma from TB patients and healthy donors or in PBMCs following antigen-specific stimulated cell culture. Horizontal bars represent median values, boxes represent the interquartile range (25–75%) and whiskers represent the highest and the lowest values. Horizontal lines indicate a statistically significant difference between groups. *p<0.05; **p<0.005.
Figure 4
Figure 4. Comparison of cytokine/chemokine expression in plasma or pleural effusions or in vitro after M.tb antigen-specific stimulation of PFMCs.
A. Levels of IL-6, IL-13 and G-CSF in plasma from active pulmonary tuberculosis (TB) and tuberculous pleurisy (TP) patients or the pleural effusions from tuberculous pleurisy (TPF) and lung cancer (CFP) patients. PFMCs from tuberculous pleurisy patients were collected for M.tb antigen-specific stimulation in vitro. The levels of IL-6, IL-13 and G-CSF in stimulated cell cultures are shown in the panels below. B: IL-4 and IL-15 levels in plasma or pleural effusions (above) and in PFMCs antigen-specific stimulated cell cultures (below). C: Chemokine levels in the plasma or pleural effusions (lines 1 and 3) and in antigen-specific stimulated PFMCs cultures (lines 2 and 4). Horizontal bars represent median values, boxes represent the interquartile range (25–75%) and whiskers represent the highest and the lowest values. Horizontal lines indicate a statistically significant difference between groups. *p<0.05; **p<0.005; *** p<0.0005.
Figure 5
Figure 5. Correlation analysis between CXCL9 and CXCL6 concentrations and IFN-γ ELISPOT SFC values or IFN-γ plasma concentration.
The correlation coefficient was assessed using Pearson’s two-tailed correlation test.

References

    1. WHO (2010) Report: Global tuberculosis control.
    1. WHO (2008) Report : Stop TB Partnership.
    1. Pathan AA, Wilkinson KA, Klenerman P, McShane H, Davidson RN, et al. (2001) Direct ex vivo analysis of antigen-specific IFN-gamma-secreting CD4 T cells in Mycobacterium tuberculosis-infected individuals: associations with clinical disease state and effect of treatment. J Immunol 167: 5217–5225. - PubMed
    1. Sia IG, Wieland ML (2011) Current concepts in the management of tuberculosis. Mayo Clin Proc 86: 348–361. - PMC - PubMed
    1. Warier A, Gunawathi S, Venkatesh, John KR, Bose A (2010) T-cell assay as a diagnostic tool for tuberculosis. Indian Pediatr 47: 90–92. - PubMed

Publication types

MeSH terms