. 2012;7(9):e45007.
doi: 10.1371/journal.pone.0045007. Epub 2012 Sep 18.

Genetic diversity and ecosystem functioning in the face of multiple stressors

Affiliations

Genetic diversity and ecosystem functioning in the face of multiple stressors

Fabian Roger et al. PLoS One. 2012.

Abstract

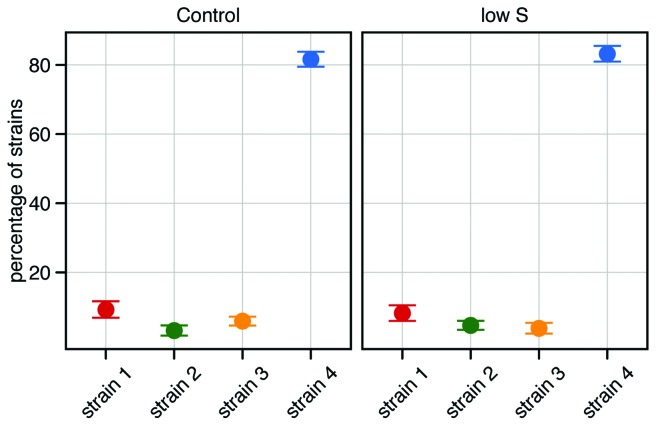
Species diversity is important for a range of ecosystem processes and properties, including the resistance to single and multiple stressors. It has been suggested that genetic diversity may play a similar role, but empirical evidence is still relatively scarce. Here, we report the results of a microcosm experiment where four strains of the marine diatom Skeletonema marinoi were grown in monoculture and in mixture under a factorial combination of temperature and salinity stress. The strains differed in their susceptibility to the two stressors and no strain was able to survive both stressors simultaneously. Strong competition between the genotypes resulted in the dominance of one strain under both control and salinity stress conditions. The overall productivity of the mixture, however, was not related to the dominance of this strain, but was instead dependent on the treatment; under control conditions we observed a positive effect of genetic richness, whereas a negative effect was observed in the stress treatments. This suggests that interactions among the strains can be both positive and negative, depending on the abiotic environment. Our results provide additional evidence that the biodiversity-ecosystem functioning relationship is also relevant at the level of genetic diversity.


Conflict of interest statement

Competing Interests: The authors have declared that no competing interests exist.

Figures

Figure 1
Figure 1. Growth curves.
Growth curves of strain 1–4 (red, green, yellow and blue, respectively) and the mixture (violet) comprising all four clones in equal proportions. Each panel represents one salinity×temperature treatment (Control: Salinity 25, Temperature 20°C; high T: Salinity 25, Temperature 28°C; low S: Salinity 7, Temperature 20°C; high T/low S: Salinity 7, Temperature 28°C). Data points represent the mean of the four replicates; error bars represent standard error of mean. Start concentrations were 6000 cells ml–1 in all treatments. Biomass units are raw fluorescence data. The experiment was terminated on day 9.
Figure 2
Figure 2. Growth dynamics.
Growth dynamics of the four strains in monocultures (red, green, yellow and blue for strain 1–4 respectively) and the mixture (violet) in the three treatments in which growth was observed, plotted per treatment. Control: Temperature = 20°C, Salinity = 25; high T: Temperature = 28°C, Salinity = 27; low S: Temperature = 20°C, Salinity = 7. The ellipses represent 95% confidence intervals of the bootstrapped parameter distributions of the modelled growth curves. K represents maximum biomass and the units are raw fluorescence of Chl a, and r is the maximum growth rate given in cell divisions per day. The range of the axes is standardized in order to represent the same amount of relative variance around the overall mean of r and K, respectively.
Figure 3
Figure 3. Growth dynamics.
Growth dynamics of the four strains in monocultures (red, green, yellow and blue for clone 1–4 respectively) and mixture (violet) in the three treatments in which growth was observed, plotted per strain and the mixture. [C]: Temperature = 20°C, Salinity = 25; [T] = 28°C, Salinity = 27; [S]: Temperature = 20°C, Salinity = 7. The ellipses represent 95% confidence intervals of the bootstrapped parameter distributions of the modelled growth curves. K represents maximum biomass and the units are raw fluorescence of Chl a, and r is maximum growth rate given in cell divisions per day. The range of the axes is standardized in order to represent the same amount of relative variance around the overall mean of r and K, respectively.
Figure 4
Figure 4. Relative abundances of the strains.
Relative abundances of the strains 1–4 (red, green, yellow and blue, respectively) in the mixture of the control (Salinity 25, Temperature 20°C) and the low salinity (Salinity 7, Temperature 20°C) treatments. Proportions are given in percentages and represent the average abundance of the four replicates. Error bars are standard error of the mean.
Figure 5
Figure 5. Partitioning of the diversity effect.
Partitioning of the net diversity effect into a selection and a complementarity effect for the control (Salinity 25, Temperature 20°C) and the low salinity (Salinity 7, Temperature 20°C) treatments. For the high temperature treatment (Salinity 25, Temperature 28°C) the partitioning was not possible and only the net diversity effect is shown. Error bars represent the 95% confidence intervals.

References

    1. Naeem S, Bunker DE, Hector A, Loreau M, Perrings C (2009) Biodiversity, ecosystem functioning, and human wellbeing: an ecological and economic perspective. Oxford: Oxford University Press.
    1. Cardinale BJ, Matulich K, Hooper DU, Byrnes JE, Duffy E, et al. (2011) The functional role of producer diversity in ecosystems. American Journal of Botany 98: 572–592 doi: 10.3732/ajb.1000364. - DOI - PubMed
    1. Hooper DU, Adair EC, Cardinale BJ, Byrnes JEK, Hungate BA, et al.. (2012) A global synthesis reveals biodiversity loss as a major driver of ecosystem change. Nature. doi: 10.1038/nature11118. - DOI - PubMed
    1. Griffin JN, O'Gorman EJ, Emmerson MC, Jenkins SR, Klein A-M, et al.. (2009) Biodiversity and the stability of ecosystem functioning. In: Naeem S, Bunker DE, Hector A, Loreau M, Perrings C, editors. Biodiversity, ecosystem functioning, and human wellbeing: an ecological and economic perspective. Oxford: Oxford University Press. 78–93.
    1. Frankham R (2005) Genetics and extinction. Biological Conservation 126: 131–140 doi: 10.1016/J.Biocon.2005.05.002. - DOI

Publication types