. 2012;7(9):e45425.
doi: 10.1371/journal.pone.0045425. Epub 2012 Sep 21.

VSL#3 resets insulin signaling and protects against NASH and atherosclerosis in a model of genetic dyslipidemia and intestinal inflammation

Affiliations

VSL#3 resets insulin signaling and protects against NASH and atherosclerosis in a model of genetic dyslipidemia and intestinal inflammation

Andrea Mencarelli et al. PLoS One. 2012.

Abstract

Background: Signals generated by the inflammed intestine are thought to contribute to metabolic derangement. The intestinal microbiota contributes to instructing the immune system beyond the intestinal wall and its modulation is a potential target for treating systemic disorders.

Aims: To investigate the pathogenetic role of low grade intestinal inflammation in the development of steatohepatitis and atherosclerosis in a model of genetic dyslipidemia and to test the therapeutic potential of a probiotics intervention in protecting against development of these disorders.

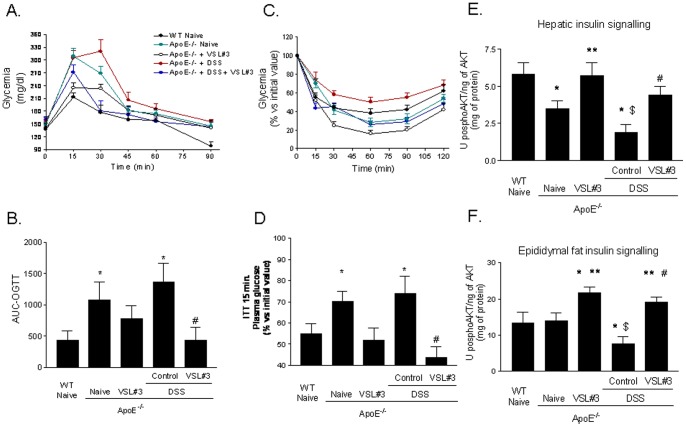
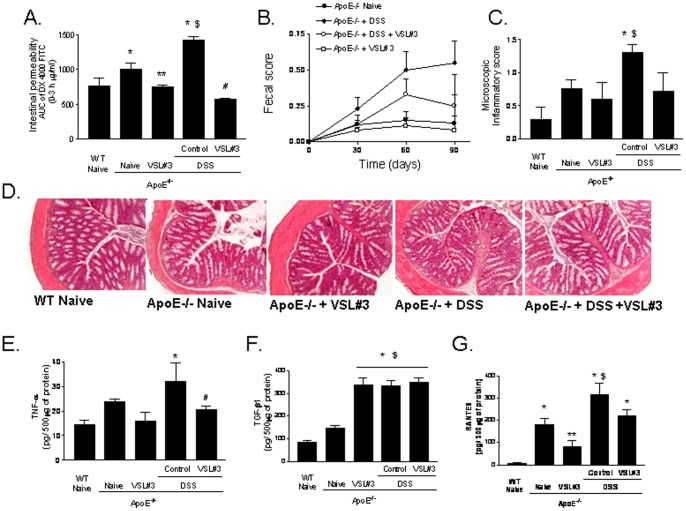
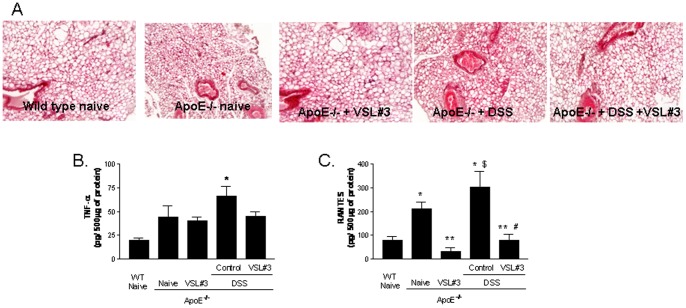
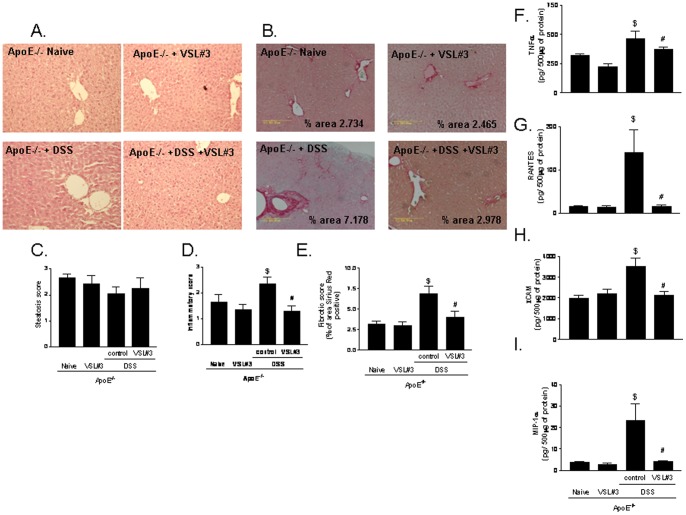
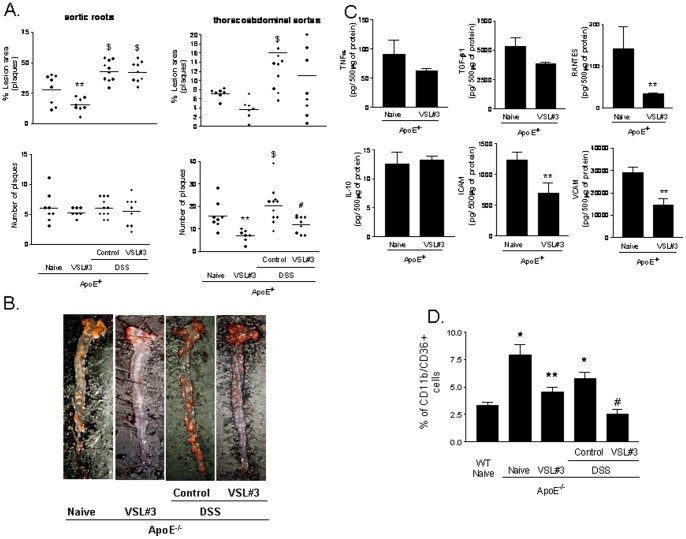
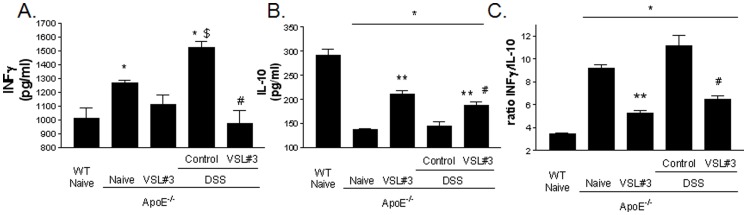
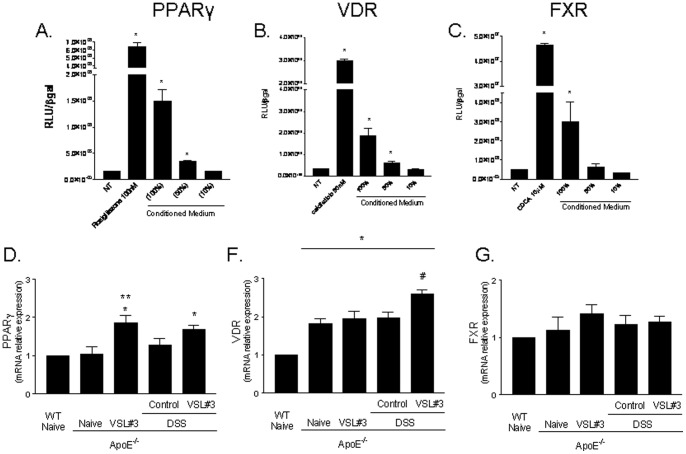
Results: ApoE(-/-) mice were randomized to receive vehicle or VSL#3, a mixture of eight probiotics, at the dose of 20×10(9) colony-forming units/kg/day for three months alone or in combination with 0.2% of dextran sulfate sodium (DSS) in drinking water. Administering DSS to ApoE(-/-) mice failed to induce signs and symptoms of colitis but increased intestinal permeability to dextran FITC and, while had no effect on serum lipids, increased the blood levels of markers of liver injury and insulin resistance. DSS administration associated with low level inflammation of intestinal and mesenteric adipose tissues, caused liver histopathology features of steatohepatitis and severe atherosclerotic lesions in the aorta. These changes were prevented by VSL#3 intervention. Specifically, VSL#3 reversed insulin resistance, prevented development of histologic features of mesenteric adipose tissue inflammation, steatohepatitis and reduced the extent of aortic plaques. Conditioned media obtained from cultured probiotics caused the direct transactivation of peroxisome proliferator-activated receptor-γ, Farnesoid-X-receptors and vitamin D receptor.

Conclusions: Low grade intestinal inflammation drives a transition from steatosis to steatohepatitis and worsens the severity of atherosclerosis in a genetic model of dyslipidemia. VSL#3 intervention modulates the expression of nuclear receptors, corrects for insulin resistance in liver and adipose tissues and protects against development of steatohepatitis and atherosclerosis.


Conflict of interest statement

Competing Interests: The authors have declared that no competing interests exist.

Figures

Figure 1
Figure 1. VSL#3 administration reverts insulin resistance in ApoE−/− mice: effect on OGTT, ITT and insulin signaling.
ApoE−/− mice were administered daily with VSL#3 alone or in combination with DSS for 12 weeks starting at the age of 8–9 months. The OGTTs were performed after 10 weeks of treatment. A) Blood glucose levels in response to OGTT. B) Area under the OGTT curve (AUC) from 0 to 120 min after glucose administration: all curves were adjusted by subtracting the initial glucose values from actual glucose measurements. The ITTs were performed after 11 weeks of treatment, the data were expressed as % of basal glucose values . C) The ITTs were performed. D) illustrates glucose plasma levels after 15 minutes of insulin administration. Mean ± SE is plotted; n = 8–12 mice per group. Effect of VSL#3 administration on AKT Ser(473) phosphorylation in (E) liver and (F) epididymal fat tissues. Data are means ± SE of n = 8 mice per group. * p<0.05 ApoE−/− experimental group versus naive wild type group; ** p<0.05 ApoE−/− naïve group versus ApoE−/− plus VSL#3 group; $ p<0.05 ApoE−/− naive group versus ApoE−/− plus DSS group; # p<0.05 ApoE−/− plus DSS group versus ApoE−/− plus DSS and VSL#3 group.
Figure 2
Figure 2. Effect of VSL#3 administration in intestinal homeostasis. A
) Intestinal permeability assay after oral challenge with 4000 Da fluorescent dextran-FITC (DX-4000-FITC); area under curve (AUC) of plasma DX-4000–FITC (μg/ml). B) Fecal score. C) Microscopy inflammatory score D) Histolopathology analysis of colon samples obtained from experimental groups. Original magnification 20×, H&E staining. Colonic cytokines content: (E) TNFα, (F) TGFβ1 and (G) RANTES. Data are mean ± SE of n = 7 mice per group. * p<0.05 ApoE−/− experimental group versus naive wild type group; ** p<0.05 ApoE−/− naïve group versus ApoE−/− plus VSL#3 group; $ p<0.05 ApoE−/− naive group versus ApoE−/− plus DSS group;# p<0.05 ApoE−/− plus DSS group versus ApoE−/− plus DSS and VSL#3 group.
Figure 3
Figure 3. Effect of VSL#3 administration in mesenteric fat inflammation. A)
Histopathology analysis of mesenteric fat isolated from experimental groups, original magnification 20×, H&E staining. Adipose tissue concentration of (B) TNFα and (C) RANTES. Data are mean ± SE of n = 5 mice per group. * p<0.05 ApoE−/− experimental group versus naive wild type group; ** p<0.05 ApoE−/− naïve group versus ApoE−/− plus VSL#3 group; $ p<0.05 ApoE−/− naive group versus ApoE−/− plus DSS group; # p<0.05 ApoE−/− plus DSS group versus ApoE−/− plus DSS and VSL#3 group.
Figure 4
Figure 4. Effect of VSL#3 on liver inflammation and fibrosis induced by DSS administration.
Histopathology analysis of liver, A) H&E staining and B) Sirus Red staining; original magnification 20×. C) Steatosis score; D) Inflammatory score and E) Fibrosis score. Data are mean ± SE of n = 8–12 mice per group. Liver content of inflammatory mediators including (F) TNFα, (G) RANTES, (H) ICAM-1, and (I) MIP-1α. Data are mean ± SE of n = 5 mice per group. * p<0.05 ApoE−/− experimental group versus naive wild type group; ** p<0.05 ApoE−/− naïve group versus ApoE−/− plus VSL#3 group; $ p<0.05 ApoE−/− naive group versus ApoE−/− plus DSS group; # p<0.05 ApoE−/− plus DSS group versus ApoE−/− plus DSS and VSL#3 group.
Figure 5
Figure 5. Effect of VSL#3 administration on atherosclerosis development in ApoE−/− mice. Panel A.
Administration of DSS to ApoE−/− for 12 weeks increases the size of aortic plaques (ratio of plaque surface area to vessel surface area) and numbers of plaques. Individual data are shown n = 7–12. Panel B. Representation of aortic plaques from individual animals. The images shows the plaque surface from individual animals, each one representative of a specific experimental group. The lipids in the vessel wall were staining with Sudan IV. Panel C. Aortic concentration of TNFα, TGF-β1, RANTES, IL-10, ICAM-1 and VCAM. Data are mean ± SE of n = 5 mice per group. D) VSL#3 intervention reduced the percentage of CD36 positive cells on circulating macrophages. The mean ± SE of n = 5 mice per group is shown. * p<0.05 ApoE−/− experimental group versus naive wild type group; ** p<0.05 ApoE−/− naïve group versus ApoE−/− plus VSL#3 group; $ p<0.05 ApoE−/− naive group versus ApoE−/− plus DSS group; # p<0.05 ApoE−/− plus DSS group versus ApoE−/− plus DSS and VSL#3 group.
Figure 6
Figure 6. Effect of VSL#3 administration on the induction of T-lymphocytes IL-10-producing cells in spleen in ApoE−/−mice.
T-lymphocytes were isolated from spleens of mice and then stimulated with concanavalin A for 36 h in vitro. INFγ and IL-10 in the supernatants were assayed by ELISA. The bar indicates mean ± SE of 5 samples from 5 mice in each group. * p<0.05 ApoE−/− experimental group versus naive wild type group; ** p<0.05 ApoE−/− naïve group versus ApoE−/− plus VSL#3 group; $ p<0.05 ApoE−/− naive group versus ApoE−/− plus DSS group;# p<0.05 ApoE−/− plus DSS group versus ApoE−/− plus DSS and VSL#3 group.
Figure 7
Figure 7. Effect of VSL#3 administration on PPARy, VDR and FXR, activity and expression. A
) Luciferase reporter assay performed in HepG2 transiently transfected with p(UAS)5-TKLUC, pSG5GAL4-PPARγ and pCMV-βgal vectors and stimulated 18 h with rosiglitazone 100 nM and condiditioned media (CM) undiluted, diluted 1∶2 (50%) and 1∶10 (10%). *p<0.05 versus not treated (NT); B) Luciferase reporter assay performed in HepG2 transiently transfected with p(UAS)5-TKLUC, pSG5GAL4-VDR and pCMV-βgal vectors and stimulated 18 h with 25-hydroxycholecalciferol, 50 nM, and CM undiluted, diluted 1∶2 (50%) or 1∶10 (10%). *p<0.05 versus not treated (NT); C) Luciferase reporter assay performed in HepG2 transiently transfected with p(hsp27)TKLUC, pSG5-FXR, pSG5-RXR, pCMV-βgal vectors and stimulated 18 h with CDCA 10 μM and CM undiluted, diluted 1∶2 (50%) and diluted 1∶10 (10%). *p<0.05 versus not treated (NT). (Panel D–G) RT-PCR analysis of the intestinal expression of PPARγ, VDR and FXR. Data represent the mean ± SE of 5 mice per group. * p<0.05 ApoE−/− experimental group versus naive wild type group; ** p<0.05 ApoE−/− naïve group versus ApoE−/− plus VSL#3 group; $ p<0.05 ApoE−/− naive group versus ApoE−/− plus DSS group; # p<0.05 ApoE−/− plus DSS group versus ApoE−/− plus DSS and VSL#3 group.

References

    1. Alberti KG, Eckel RH, Grundy SM, Zimmet PZ, Cleeman JI, et al. (2009) Harmonizing the metabolic syndrome: a joint interim statement of the International Diabetes Federation Task Force on Epidemiology and Prevention; National Heart, Lung, and Blood Institute; American Heart Association; World Heart Federation; International Atherosclerosis Society; and International Association for the Study of Obesity. Circulation 120: 1640–1645. - PubMed
    1. Reinhard W, Holmer SR, Fischer M, Gloeckner C, Hubauer U, et al. (2006) Association of the metabolic syndrome with early coronary disease in families with frequent myocardial infarction. Am J Cardiol 97: 964–967. - PubMed
    1. Loria P, Lonardo A, Carulli N (2005) Should nonalcoholic fatty liver disease be renamed? Dig Dis 23: 72–82. - PubMed
    1. Kotronen A, Westerbacka J, Bergholm R, Pietilainen KH, Yki-Jarvinen H (2007) Liver fat in the metabolic syndrome. J Clin Endocrinol Metab 92: 3490–3497. - PubMed
    1. Marchesini G, Bugianesi E, Forlani G, Cerrelli F, Lenzi M, et al. (2003) Nonalcoholic fatty liver, steatohepatitis, and the metabolic syndrome. Hepatology 37: 917–923. - PubMed

Substances