. 2012;7(9):e45466.
doi: 10.1371/journal.pone.0045466. Epub 2012 Sep 21.

High-resolution transcriptome of human macrophages

Affiliations

High-resolution transcriptome of human macrophages

Marc Beyer et al. PLoS One. 2012.

Abstract

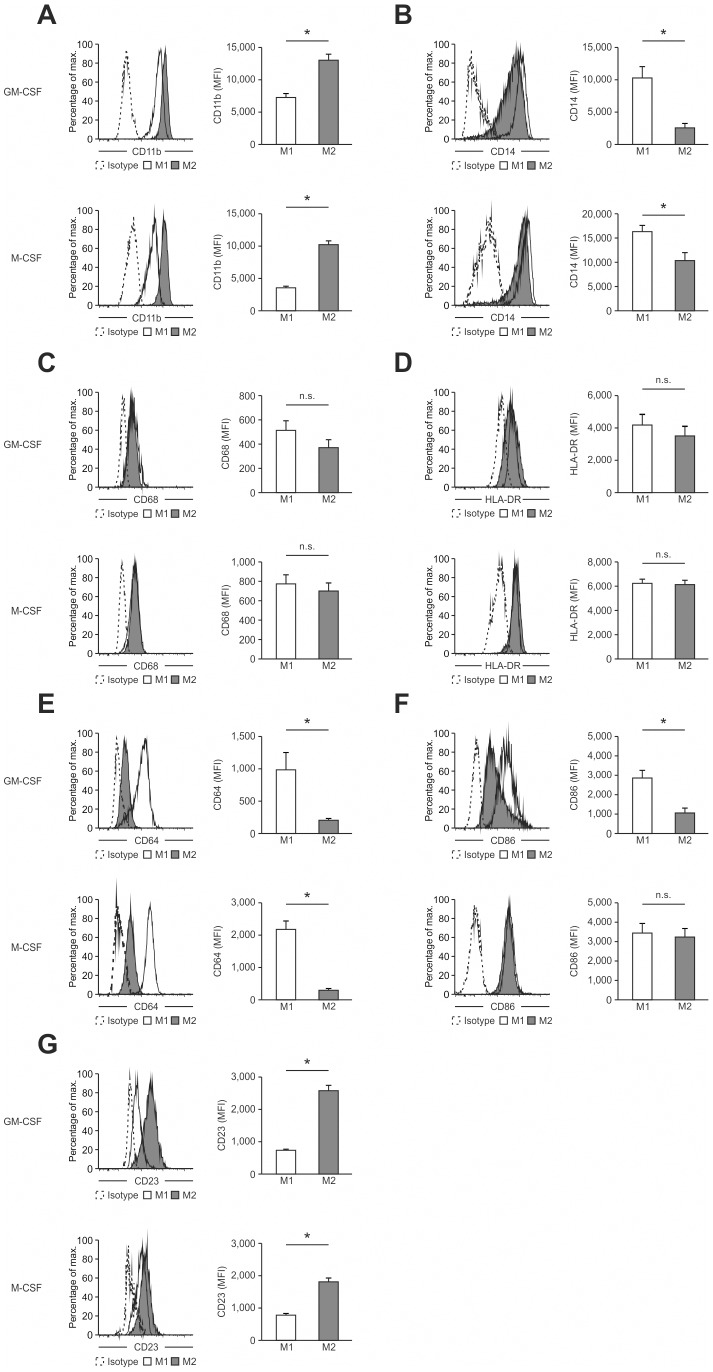
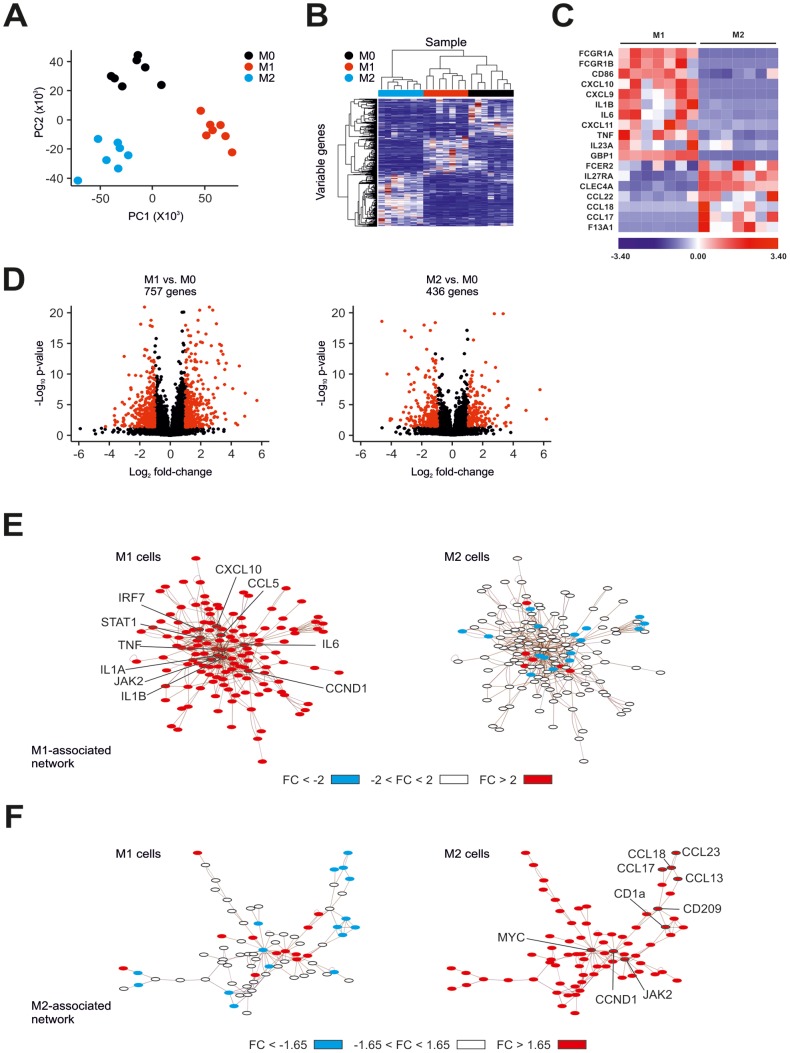
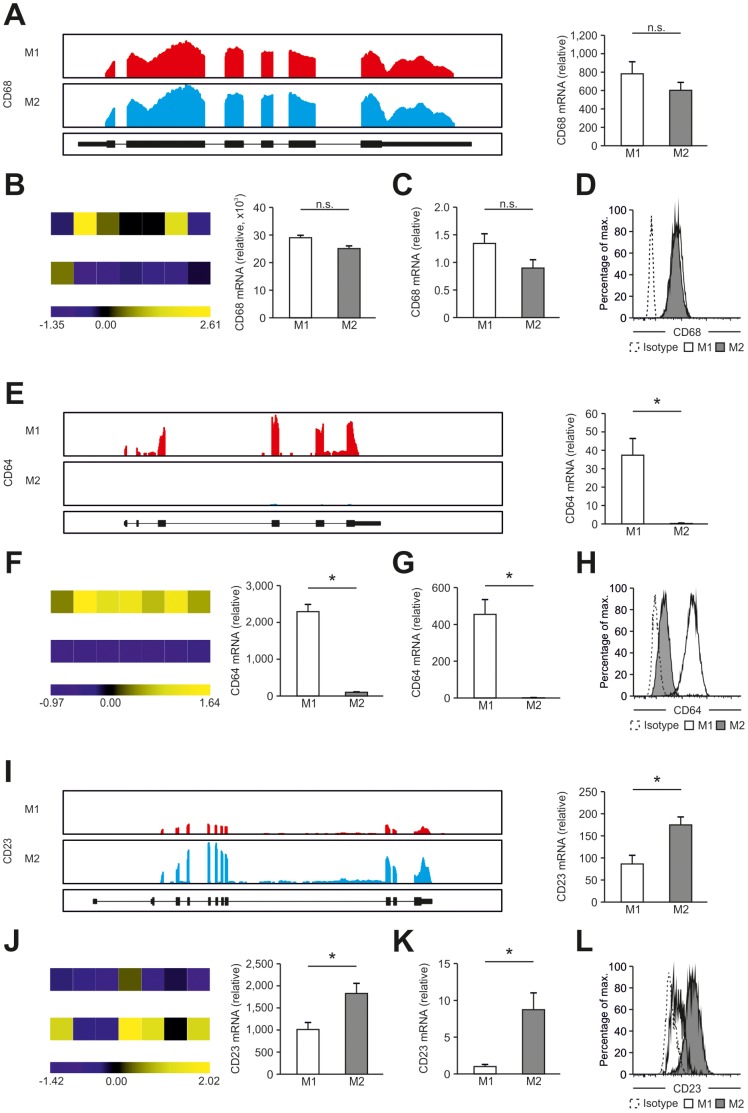
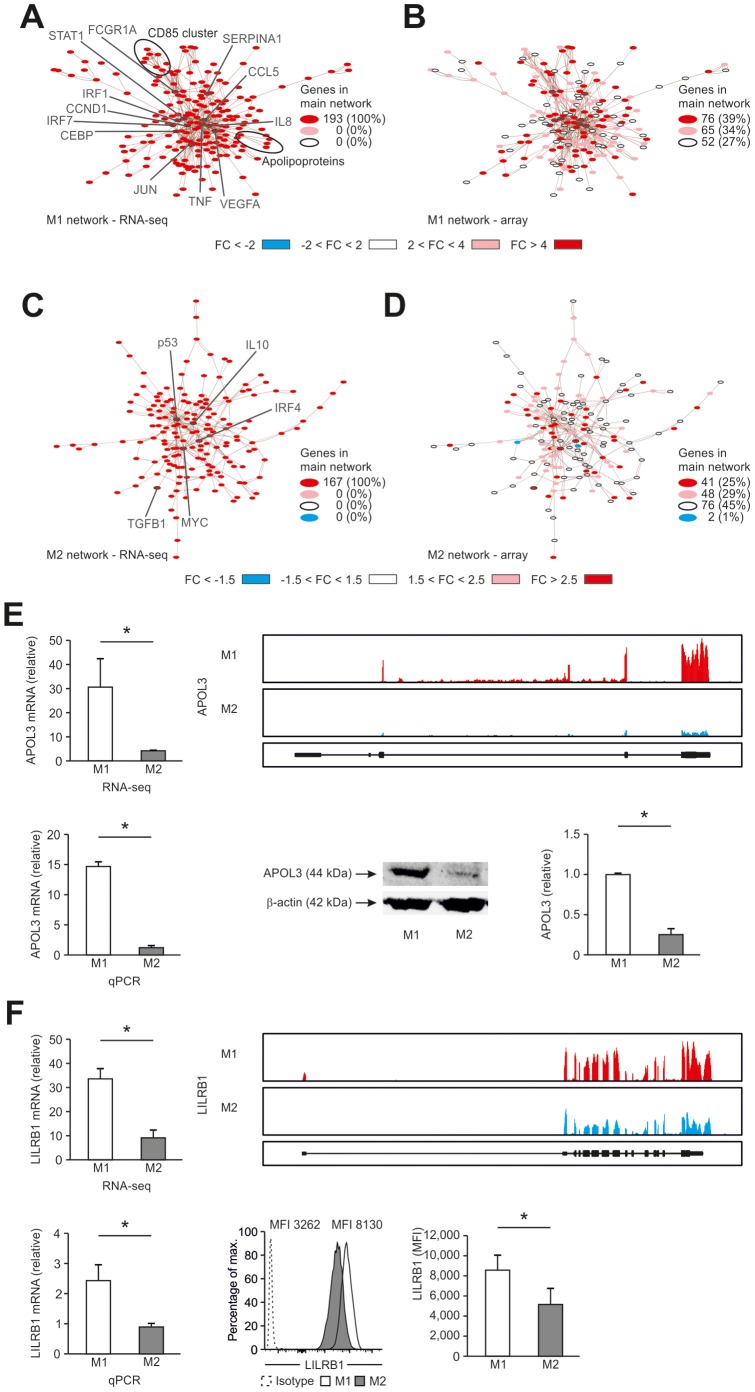
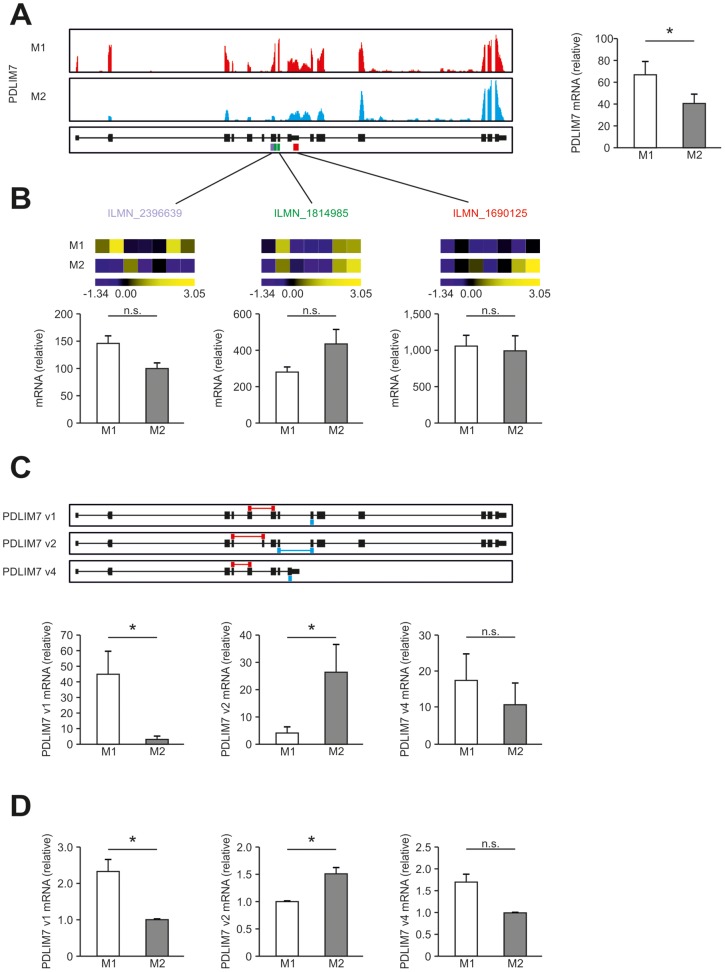
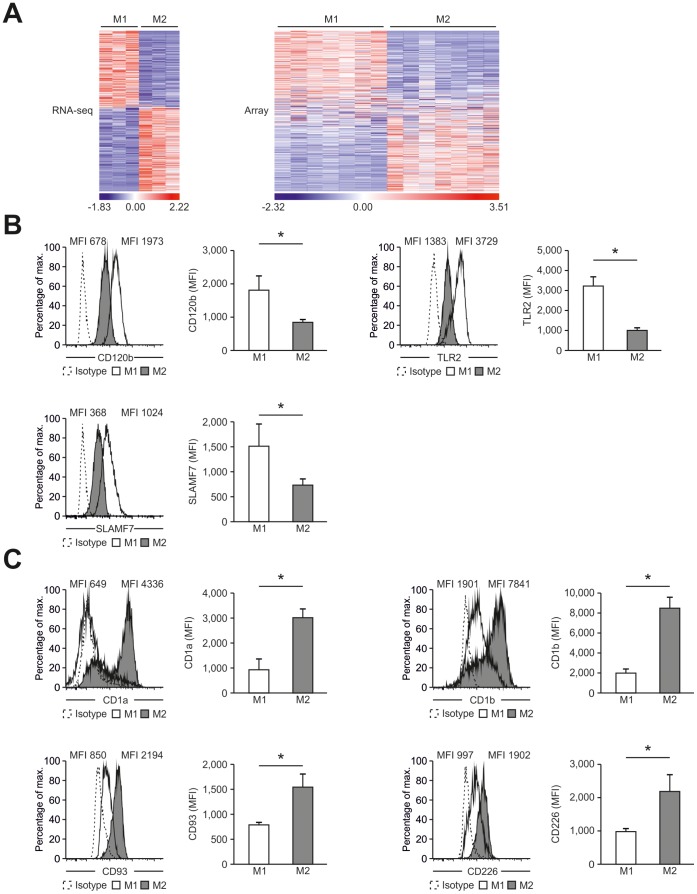
Macrophages are dynamic cells integrating signals from their microenvironment to develop specific functional responses. Although, microarray-based transcriptional profiling has established transcriptional reprogramming as an important mechanism for signal integration and cell function of macrophages, current knowledge on transcriptional regulation of human macrophages is far from complete. To discover novel marker genes, an area of great need particularly in human macrophage biology but also to generate a much more thorough transcriptome of human M1- and M1-like macrophages, we performed RNA sequencing (RNA-seq) of human macrophages. Using this approach we can now provide a high-resolution transcriptome profile of human macrophages under classical (M1-like) and alternative (M2-like) polarization conditions and demonstrate a dynamic range exceeding observations obtained by previous technologies, resulting in a more comprehensive understanding of the transcriptome of human macrophages. Using this approach, we identify important gene clusters so far not appreciated by standard microarray techniques. In addition, we were able to detect differential promoter usage, alternative transcription start sites, and different coding sequences for 57 gene loci in human macrophages. Moreover, this approach led to the identification of novel M1-associated (CD120b, TLR2, SLAMF7) as well as M2-associated (CD1a, CD1b, CD93, CD226) cell surface markers. Taken together, these data support that high-resolution transcriptome profiling of human macrophages by RNA-seq leads to a better understanding of macrophage function and will form the basis for a better characterization of macrophages in human health and disease.


Conflict of interest statement

Competing Interests: Research support to J.L.S. has in part been provided by Becton Dickinson. J.L.S. and M.R.M. have applied for a provisional patent concerning human macrophage marker genes (EP 12159479.0, “High resolution transcriptome of human macrophages”); however, this does not compromise the authors’ willingness to adhere to all the PLOS ONE policies on sharing data and materials.

Figures

Figure 1
Figure 1. Phenotypic characterization of human M1- and M2-like macrophages derived from CD14+ peripheral blood monocytes.
Expression of typical macrophage lineage markers was determined by flow cytometry (left) of M1- and M2-like macrophages generated in the presence of GM-CSF (upper panel) or M-CSF (lower panel) with quantification shown in the graph at the right. Expression of (A) CD11b, (B) CD14, (C) CD68, (D) HLA-DR, (E) CD64, (F) CD86, and (G) CD23, respectively. Isotype controls are depicted as dotted lines. *P<0.05 (Student’s t-test). Numbers in plots indicate mean fluorescence intensity. Data are representative of nine independent experiments (A,B,D,E,F,G; mean and s.e.m.) or eight independent experiments (C; mean and s.e.m.), each with cells derived from a different donor.
Figure 2
Figure 2. Microarray-based RNA fingerprinting of human M1- and M2-like macrophages.
(A) Principle component analysis of human unpolarized (M0) and polarized (M1, M2) macrophages. (B) Unsupervised hierarchical clustering of human M0, M1-, and M2-like macrophages. (C) Visualization of known markers for human M1- and M2-like macrophages as a heatmap. Data were z-score normalized. (D) Volcano plots showing fold-change and p-value for the comparisons of M1-like versus M0 (left) and M2-like versus M0 macrophages (right). Differentially expressed genes (FC ≥2, p-value <0.05 with FDR, diff >100) are depicted in red. (E) Left: network of genes highly expressed in M1-like macrophages (fold-change >2.0) in comparison to M0 macrophages identified by microarray analysis. Right: data for the comparison of M2-like versus M0 macrophages were loaded into the M1-network. (F) Right: network of genes highly expressed in M2-like macrophages (fold-change >1.65) in comparison to M0 macrophages identified by microarray analysis. Left: data for the comparison of M1-like versus M0 macrophages were loaded into the M2-network. All networks were generated using EGAN.
Figure 3
Figure 3. Comparison of RNA-seq and microarray analysis.
(A) Number of genes expressed in human M1- (left) and M2-like macrophages (right) as detected using RNA-seq (black) and microarray analysis (white). (B) Correlation (Spearman) of mean expression values of M1- (left) and M2-like macrophages (right) using RNA-seq and microarray analysis. (C–D) Comparison of differentially expressed genes detected using RNA-seq or microarray analysis (p<0.05). Differentially expressed genes as assessed by RNA-seq (black) or microarray analysis (white) were divided into groups by their relative expression in (C) M1 versus M2 or (D) M2 versus M1. (E) Gene expression in M1- versus M2-like macrophages as fold change versus fold change plot comparing microarray analysis with RNA-seq using all Refseq genes differentially expressed in RNA-seq. (F) Venn-diagram of differentially expressed genes between M1- and M2-like macrophages (M1 vs. M2) in RNA-seq (blue) and microarray analysis (red), (FC ≥2, p-value <0.05 with FDR, diff >100 for microarray data). Fold-change-rank plots of genes detected as differentially expressed between M1- and M2-like macrophages (G) by microarray analysis (red) with overlay of values obtained by RNA-seq (blue) or (H) by RNA-seq (blue) with overlay of values obtained by microarray analysis (red). (I) Visualization of known markers for human M1- (left) and M2-like macrophages (right) from Fig. 2C as a heatmap using RNA-seq. Data were z-score normalized.
Figure 4
Figure 4. Correlation of RNA-seq, microarray, qPCR, and flow cytometric analysis.
(A–D) CD68, (E–H) CD64, and (I–L) CD23 expression in human M1- and M2-like macrophages. (A, E, I) Left, representative images of sequencing reads across the genomic loci of genes expressed in human macrophages. Pictures taken from the Integrative Genomics Viewer (IGV). The height of bars represents the relative accumulated number of 100-bp reads spanning a particular sequence. Gene maps (bottom portion of each panel, oriented 5′-3′ direction) are represented by thick (exons) and thin (introns) lines. Right, RPKM values by RNA-seq in M1- and M2-like macrophages. (B, F, J) Left, heatmaps presenting microarray results from M1- and M2-like macrophages from seven donors. Data were z-score normalized. Right, relative mRNA expression. (C, G, K) Relative mRNA expression by qPCR in M1- and M2-like macrophages. (D, H, L) Protein expression was determined by flow cytometry in human M1- and M2-like macrophages. Data are representative of three experiments (RNA-seq, mean and s.e.m.), seven experiments (microarray, mean and s.e.m.), at least seven experiments (qPCR; mean and s.e.m.), and nine experiments (flow cytometry), each with cells derived from a different donor. Isotype controls are depicted as dotted lines. *P<0.05 (Student’s t-test).
Figure 5
Figure 5. Network analysis of RNA-seq data.
(A) Network of genes highly expressed in M1-like macrophages (fold-change >4.0) identified by RNA-seq. (B) Data generated by microarray analysis were loaded into the M1-network established using RNA-seq. (C) Network of genes highly expressed in M2-like macrophages (fold-change >2.5) identified by RNA-seq. (D) Data generated by microarray analysis were loaded into the M2-network established using RNA-seq. All networks were generated using EGAN. (E) APOL3 and (F) LILRB1 expression in human M1- and M2-like macrophages. Far left, relative expression as determined by RNA-seq. Left, representative images of sequencing reads across genes expressed in human macrophages as described in Fig. 4. Right, relative mRNA expression by qPCR in M1- and M2-like macrophages. Far right, protein data as determined by immunoblotting, respective flow cytometry. Data are representative of three experiments (RNA-seq, qPCR, and immunoblotting resp. flow cytometry; mean and s.e.m.) each with cells derived from a different donor. Isotype controls are depicted as dotted lines. *P<0.05 (Student’s t-test).
Figure 6
Figure 6. Detection of alternative splicing in human macrophages.
(A) Summarized expression of all PDLIM7 transcripts in human M1- and M2-like macrophages. Left, representative images of sequencing reads across genes expressed in human macrophages as described in Fig. 4. Right, RPKM values for PDLIM7 by RNA-seq in M1- and M2-like macrophages. (B) Expression of PDLIM7 as determined by microarray analysis using 3 different probes recognizing different parts of the PDLIM7 transcripts as depicted in (A). (C) Upper panel: representation of the 3 different mRNA transcripts from Refseq. Lower panel: abundance of the different transcripts as determined using Cuffdiff. (D) qPCR for the 3 different mRNA transcripts from Refseq in human M1- and M2-like macrophages. Splice variant specific primers depicted in red and blue. Data are representative of three experiments (RNA-seq), seven experiments (microarray analysis) or at least ten experiments (qPCR; mean and s.e.m.), each with cells derived from a different donor. *P<0.05 (Student’s t-test).
Figure 7
Figure 7. Identification of new macrophage polarization markers based on combined transcriptome analysis.
(A) Differentially expressed genes between M1- and M2-like macrophages of the human surfaceome were visualized as heatmaps for RNA-seq (left) and microarray analysis (right). Data were z-score normalized. (B–C) Expression of novel macrophage markers was determined by flow cytometry (left) of M1- and M2-like macrophages generated in the presence of GM-CSF with quantification shown in the graph at the right. Expression of (B) CD120b, TLR2, and SLAM7 as well as (C) CD1a, CD1b, CD93, and CD226. Isotype controls are depicted as dotted lines. *P<0.05 (Student’s t-test). Numbers in plots indicate mean fluorescence intensity. Data are representative of nine independent experiments (B,C; mean and s.e.m.) each with cells derived from a different donor.

References

    1. Geissmann F, Manz MG, Jung S, Sieweke MH, Merad M, et al. (2010) Development of monocytes, macrophages, and dendritic cells. Science 327: 656–661. - PMC - PubMed
    1. Waldo SW, Li Y, Buono C, Zhao B, Billings EM, et al. (2008) Heterogeneity of human macrophages in culture and in atherosclerotic plaques. Am J Pathol 172: 1112–1126. - PMC - PubMed
    1. Martinez FO, Gordon S, Locati M, Mantovani A (2006) Transcriptional Profiling of the Human Monocyte-to-Macrophage Differentiation and Polarization: New Molecules and Patterns of Gene Expression. The Journal of Immunology 177: 7303–7311. - PubMed
    1. Biswas SK, Mantovani A (2010) Macrophage plasticity and interaction with lymphocyte subsets: cancer as a paradigm. Nat Immunol 11: 889–896. - PubMed
    1. Mantovani A, Sica A (2010) Macrophages, innate immunity and cancer: balance, tolerance, and diversity. Curr Opin Immunol 22: 231–237. - PubMed

Publication types

Substances