. 2012;7(9):e45535.
doi: 10.1371/journal.pone.0045535. Epub 2012 Sep 21.

Unveiling clusters of RNA transcript pairs associated with markers of Alzheimer's disease progression

Affiliations

Unveiling clusters of RNA transcript pairs associated with markers of Alzheimer's disease progression

Ahmed Shamsul Arefin et al. PLoS One. 2012.

Abstract

Background: One primary goal of transcriptomic studies is identifying gene expression patterns correlating with disease progression. This is usually achieved by considering transcripts that independently pass an arbitrary threshold (e.g. p<0.05). In diseases involving severe perturbations of multiple molecular systems, such as Alzheimer's disease (AD), this univariate approach often results in a large list of seemingly unrelated transcripts. We utilised a powerful multivariate clustering approach to identify clusters of RNA biomarkers strongly associated with markers of AD progression. We discuss the value of considering pairs of transcripts which, in contrast to individual transcripts, helps avoid natural human transcriptome variation that can overshadow disease-related changes.

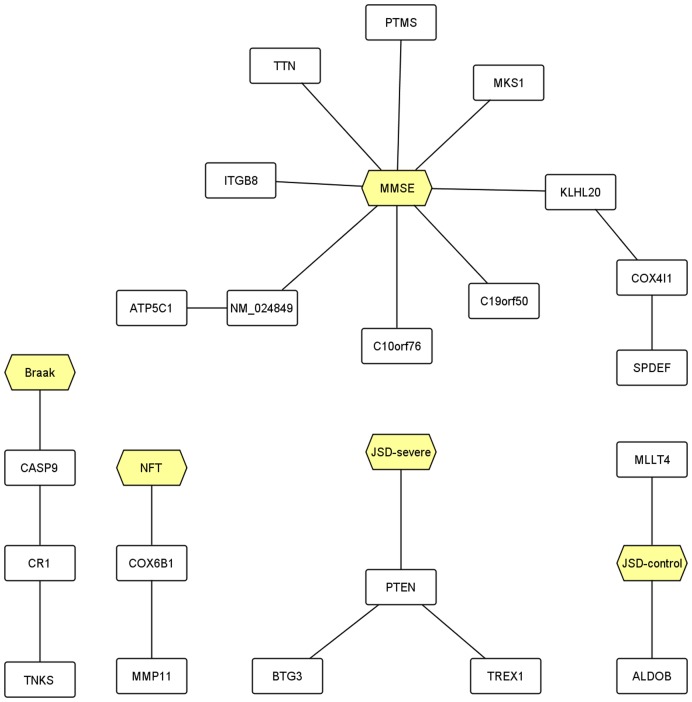
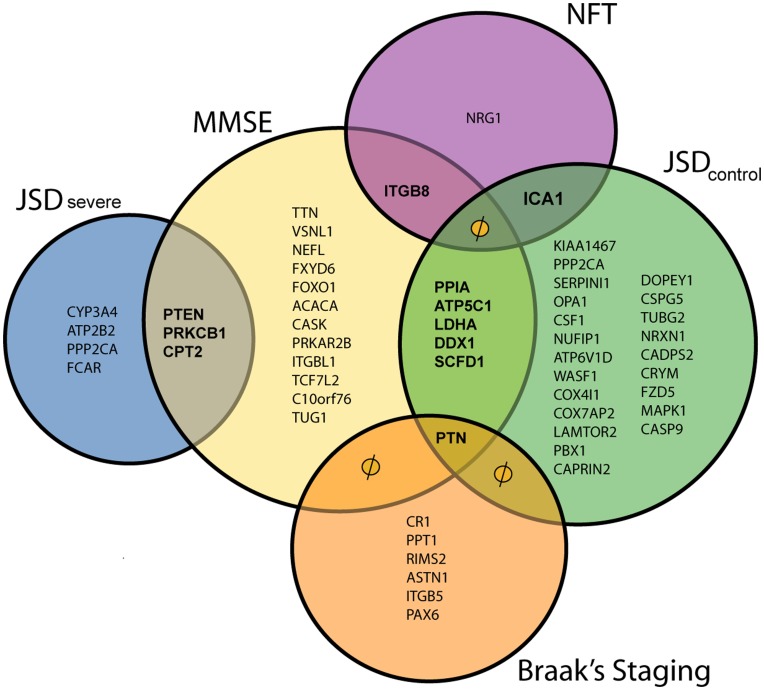
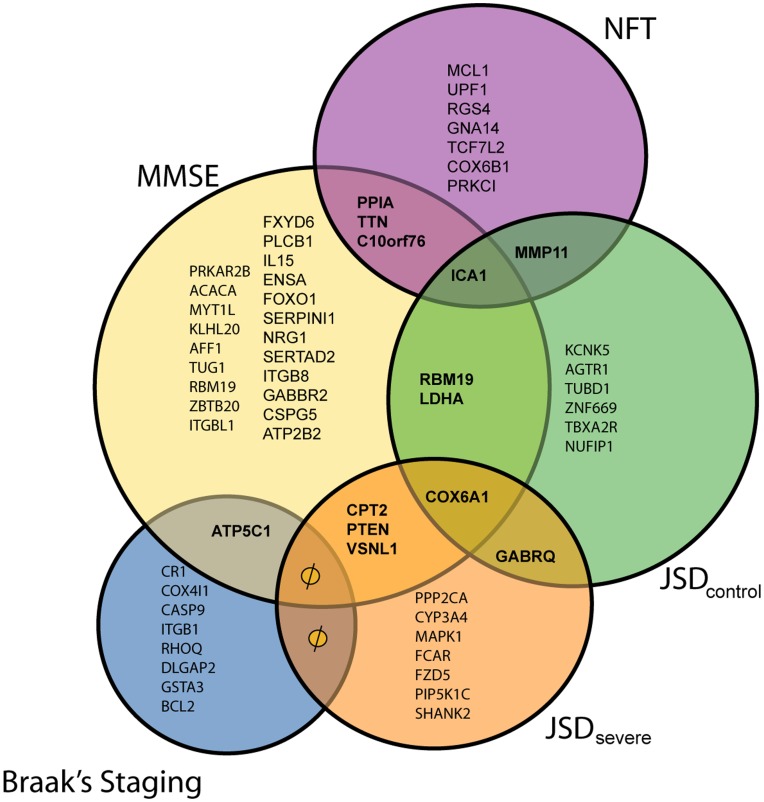
Methodology/principal findings: We re-analysed a dataset of hippocampal transcript levels in nine controls and 22 patients with varying degrees of AD. A large-scale clustering approach determined groups of transcript probe sets that correlate strongly with measures of AD progression, including both clinical and neuropathological measures and quantifiers of the characteristic transcriptome shift from control to severe AD. This enabled identification of restricted groups of highly correlated probe sets from an initial list of 1,372 previously published by our group. We repeated this analysis on an expanded dataset that included all pair-wise combinations of the 1,372 probe sets. As clustering of this massive dataset is unfeasible using standard computational tools, we adapted and re-implemented a clustering algorithm that uses external memory algorithmic approach. This identified various pairs that strongly correlated with markers of AD progression and highlighted important biological pathways potentially involved in AD pathogenesis.

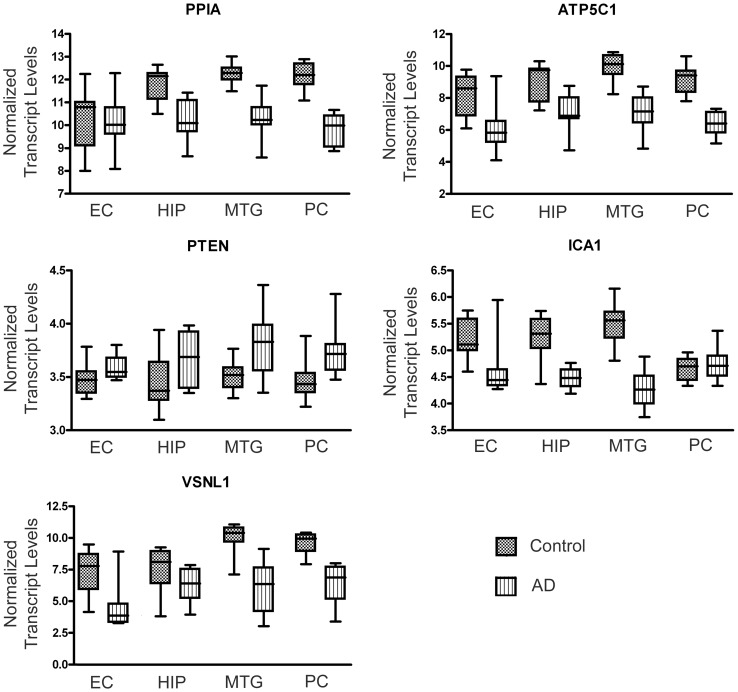
Conclusions/significance: Our analyses demonstrate that, although there exists a relatively large molecular signature of AD progression, only a small number of transcripts recurrently cluster with different markers of AD progression. Furthermore, considering the relationship between two transcripts can highlight important biological relationships that are missed when considering either transcript in isolation.


Conflict of interest statement

Competing Interests: The authors have declared that no competing interests exist.

Figures

Figure 1
Figure 1. Visualization of the clustering outcome of the 1372-probe set signature.
The figure shows only the clusters that contain the progression markers (hexagonal nodes). We note that the probe set for PTEN, whose product has been recently observed to localize with intracellular NFTs , has values that correlate strongly with the Jensen-Shannon divergence of the severe profile (JSDsevere).
Figure 2
Figure 2. Comparison of single probe set correlations and metafeature correlations.
Figure shows plots of the correlation with MMSE score of three probe sets targeting TTN, CASK and TUG1 and three metafeatures involving these probe sets (TTN/PKRCB1, CASK/PTEN and TUG1/SCFD1). In this example, the correlations between MMSE score and the metafeatures are much better than the correlation between MMSE score and the individual probe sets.
Figure 3
Figure 3. Venn diagram of the different transcripts clustered with progression markers in the 941,885 metafeatures data set.
This figure highlights the ‘robust correlating’ transcripts that are shared by different progression marker clusters. A null (φ) symbol here means that even if an overlap is shown in the figure, there is no common transcript. We refer the readers to Supporting Information Table S4., for further details of correlation of these markers to the phenotypes.
Figure 4
Figure 4. Venn diagram of the different transcripts clustered with progression markers in the 3,763,403 metafeatures data set.
This figure highlights the ‘robust correlating’ transcripts that are shared by different progression marker clusters. A null (φ) symbol here means that even if an overlap is shown in the figure, there is no common transcript. We refer the readers to Supporting Information Table S5., for further details of correlation of these markers to the phenotypes.
Figure 5
Figure 5. Validation of robust markers of AD progression in an alternative dataset.
Transcript levels for selected genes of interest were investigated in the microarray dataset of Liang and colleagues , , which assessed gene expression in healthy neurons isolated from four different regions of control and AD brain: entorhinal cortex (EC), hippocampus (HIP), middle temporal gyrus (MTG) and posterior cingulate cortex (PC). Data presented in this figure were normalized using Robust Multichip Average (RMA). In the box and whisker plots, the bottom and top of the box represent the lower and upper quartiles, respectively, and the band within the boxes represents the median, while the ends of the whiskers represent the minimum and maximum values.
Figure 6
Figure 6. Demonstration of the modified MSTkNN algorithm.
(a) An MSTp created from a data set with n=10 features/probe sets. Each edge is labeled with an integer value p, where the value of p is determined using a sorted list of nearest neighbors for each feature (see eq. (2)). The edge between F9 and F10 is a candidate for elimination, since it has a value of p > = 2 (b) Two connected components are identified and we apply the same procedure with the component that has more than three elements. (c) The final outcome of the clustering.

References

    1. Alzheimer’s Association (2011) 2011 Alzheimer’s disease facts and figures. Alzheimer’s Dement 7: 208–244. - PubMed
    1. Burns JM, Morris JC (2008) Mild cognitive impairment and early Alzheimer’s disease: detection and diagnosis: Wiley.’
    1. Blalock EM, Geddes JW, Chen KC, Porter NM, Markesbery WR, et al. (2004) Incipient Alzheimer’s disease: microarray correlation analyses reveal major transcriptional and tumor suppressor responses. Proc Natl Acad Sci U S A 101: 2173–2178. - PMC - PubMed
    1. Folstein MF, Folstein SE, McHugh PR (1975) “Mini-mental state”. A practical method for grading the cognitive state of patients for the clinician. J Psychiatr Res 12: 189–198. - PubMed
    1. Gomez Ravetti M, Rosso OA, Berretta R, Moscato P (2010) Uncovering molecular biomarkers that correlate cognitive decline with the changes of hippocampus’ gene expression profiles in Alzheimer’s disease. PLoS One 5: e10153. - PMC - PubMed

Publication types