

Monitoring and identification of sepsis development through a composite measure of heart rate variability
- PMID: 23029171
- PMCID: PMC3446945
- DOI: 10.1371/journal.pone.0045666
Monitoring and identification of sepsis development through a composite measure of heart rate variability
Abstract
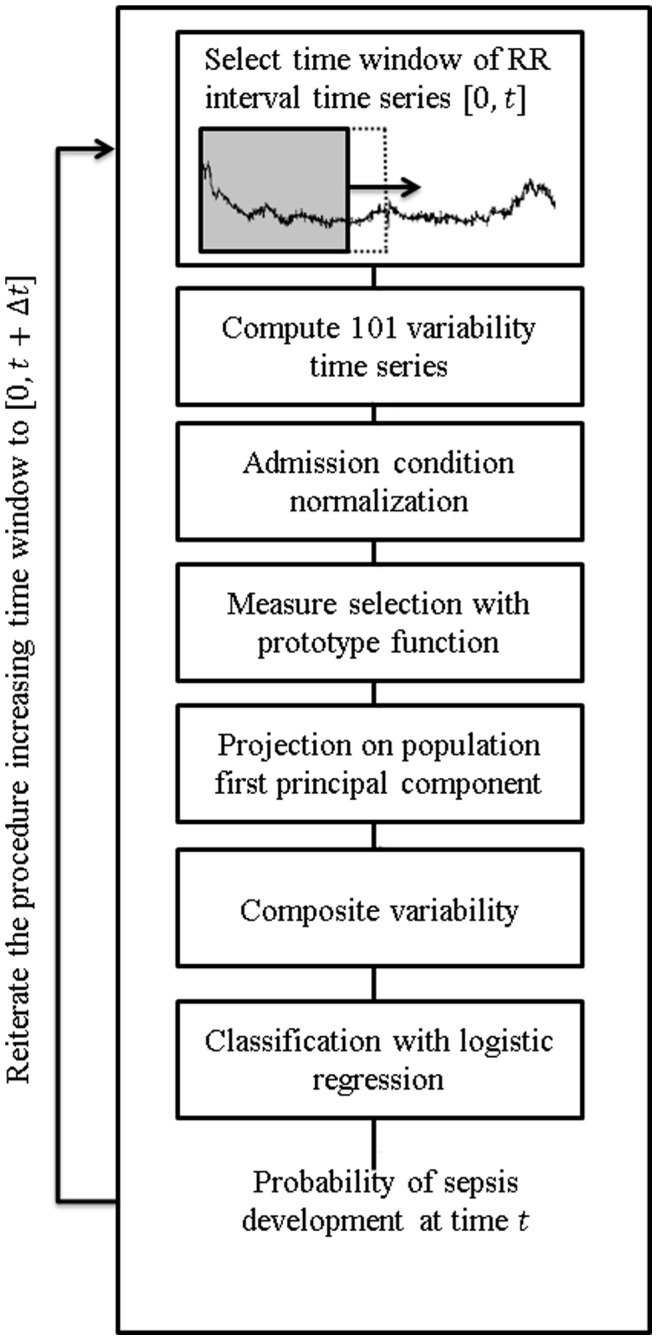
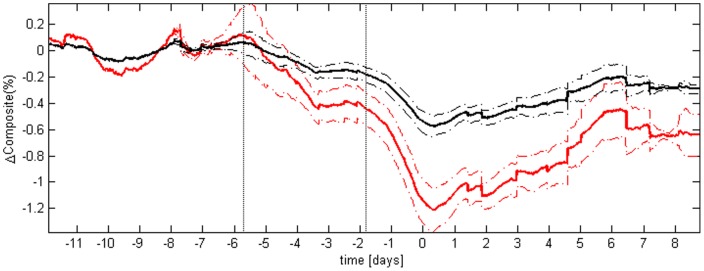
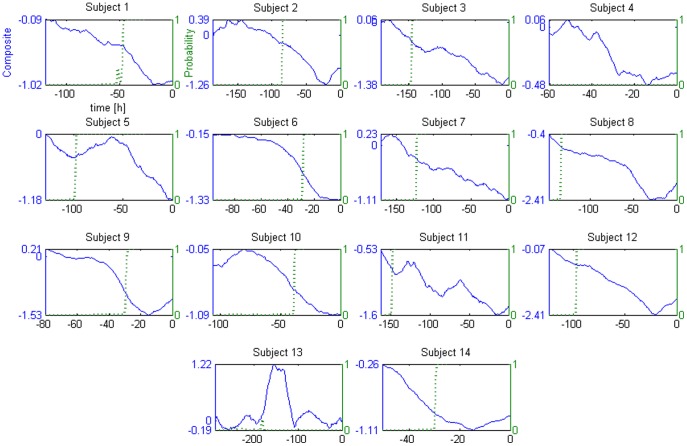
Tracking the physiological conditions of a patient developing infection is of utmost importance to provide optimal care at an early stage. This work presents a procedure to integrate multiple measures of heart rate variability into a unique measure for the tracking of sepsis development. An early warning system is used to illustrate its potential clinical value. The study involved 17 adults (age median 51 (interquartile range 46-62)) who experienced a period of neutropenia following chemoradiotherapy and bone marrow transplant; 14 developed sepsis, and 3 did not. A comprehensive panel (N = 92) of variability measures was calculated for 5 min-windows throughout the period of monitoring (12 ± 4 days). Variability measures underwent filtering and two steps of data reduction with the objective of enhancing the information related to the greatest degree of change. The proposed composite measure was capable of tracking the development of sepsis in 12 out of 14 patients. Simulating a real-time monitoring setting, the sum of the energy over the very low frequency range of the composite measure was used to classify the probability of developing sepsis. The composite revealed information about the onset of sepsis about 60 hours (median value) before of sepsis diagnosis. In a real monitoring setting this quicker detection time would be associated to increased efficacy in the treatment of sepsis, therefore highlighting the potential clinical utility of a composite measure of variability.
Conflict of interest statement
Figures
References
-
- Brindley PG, Zhu N, Sligl W (2006) Best evidence in critical care medicine Early antibiotics and survival from septic shock: it’s about time. Can J Anesth/J Can Anesth 53: 1157–1160 doi:10.1007/BF03022884. - DOI - PubMed
-
- Angus DC, Linde-Zwirble WT, Lidicker J, Clermont G, Carcillo J, et al. (2001) Epidemiology of severe sepsis in the United States: analysis of incidence, outcome, and associated costs of care. Crit. Care Med 29: 1303–1310. - PubMed
-
- Moorman JR, Lake DE, Griffin MP (2006) Heart rate characteristics monitoring for neonatal sepsis. Biomedical Engineering, IEEE Transactions on 53: 126–132. - PubMed
-
- Griffin MP, Lake DE, Bissonette EA, Harrell FE, O’Shea TM, et al. (2005) Heart Rate Characteristics: Novel Physiomarkers to Predict Neonatal Infection and Death. Pediatrics 116: 1070–1074 doi:10.1542/peds.2004-2461. - DOI - PubMed
-
- Moorman JR, Carlo WA, Kattwinkel J, Schelonka RL, Porcelli PJ, et al. (2011) Mortality Reduction by Heart Rate Characteristic Monitoring in Very Low Birth Weight Neonates: A Randomized Trial. The Journal of Pediatrics 159: 900–906.e1 doi:10.1016/j.jpeds.2011.06.044. - DOI - PMC - PubMed
MeSH terms
Substances
LinkOut - more resources
Full Text Sources
Other Literature Sources
Medical
