

Interaction between Medicago truncatula and Pseudomonas fluorescens: evaluation of costs and benefits across an elevated atmospheric CO(2)
- PMID: 23029215
- PMCID: PMC3448688
- DOI: 10.1371/journal.pone.0045740
Interaction between Medicago truncatula and Pseudomonas fluorescens: evaluation of costs and benefits across an elevated atmospheric CO(2)
Abstract
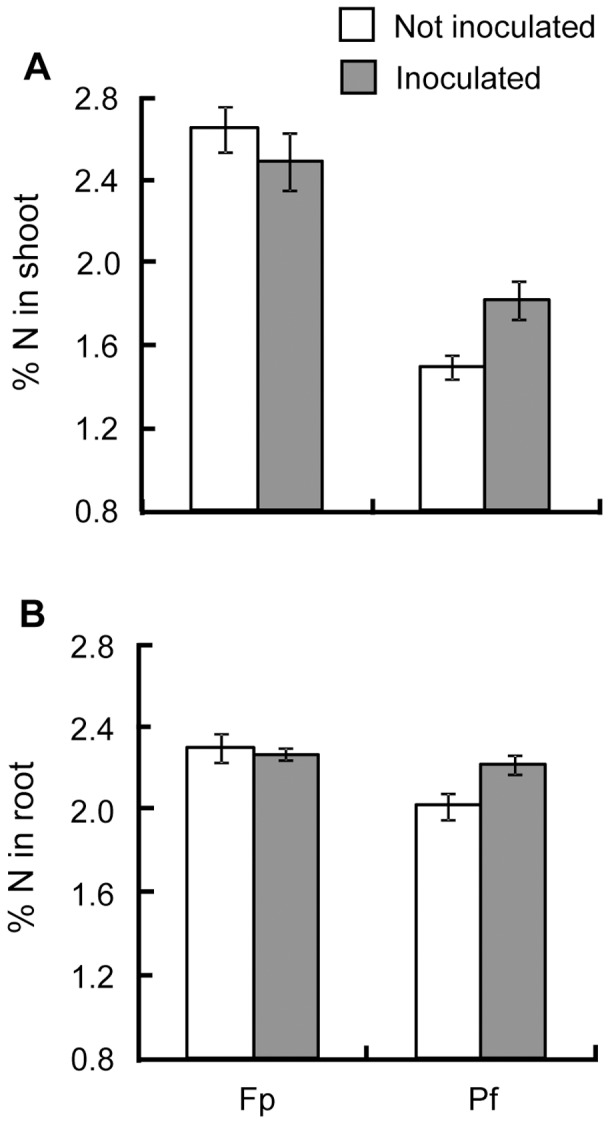
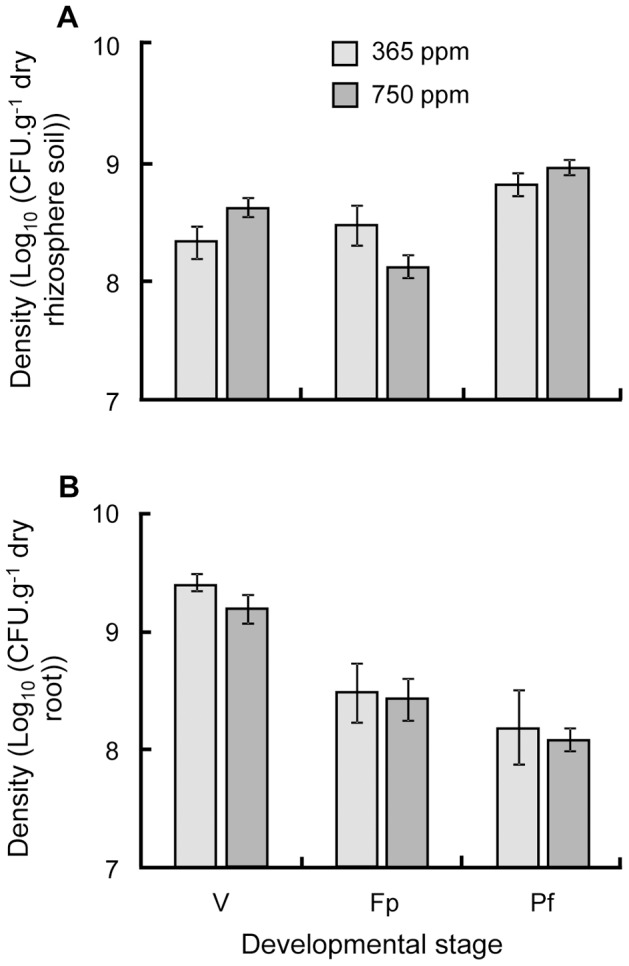
Soil microorganisms play a key role in both plants nutrition and health. Their relation with plant varies from mutualism to parasitism, according to the balance of costs and benefits for the two partners of the interaction. These interactions involved the liberation of plant organic compounds via rhizodeposition. Modification of atmospheric CO(2) concentration may affect rhizodeposition and as a consequence trophic interactions that bind plants and microorganisms. Positive effect of elevated CO(2) on plants are rather well known but consequences for micoorganisms and their interactions with plants are still poorly understood. A gnotobiotic system has been developed to study the interaction between Medicago truncatula Jemalong J5 and the mutualistic bacteria Pseudomonas fluorescens strain C7R12 under two atmospheric CO(2) concentrations: ambient (365 ppm) versus enriched (750 ppm). Costs and benefits for each partner have been determined over time by measuring plant development and growth, the C and N contents of the various plant parts and the density of the bacteria in rhizosphere compartments. Following the increase in CO(2), there was a beneficial effect of P. fluorescens C7R12 on development, vegetative growth, and C/N content of M. truncatula. Concerning plant reproduction, an early seed production was noticed in presence of the bacterial strain combined with increased atmospheric CO(2) conditions. Paradoxically, this transient increase in seed production was correlated with a decrease in bacterial density in the rhizosphere soil, revealing a cost of increased CO(2) for the bacterial strain. This shift of costs-benefits ratio disappeared later during the plant growth. In conclusion, the increase in CO(2) concentration modifies transiently the cost-benefit balance in favor of the plant. These results may be explained either by a competition between the two partners or a change in bacterial physiology. The ecosystem functioning depends on the stability of many plant-microbe associations that abiotic factors can disrupt.
Conflict of interest statement
Figures


Similar articles
-
Colonization of adventitious roots of Medicago truncatula by Pseudomonas fluorescens C7R12 as affected by arbuscular mycorrhiza.FEMS Microbiol Lett. 2008 Dec;289(2):173-80. doi: 10.1111/j.1574-6968.2008.01391.x. Epub 2008 Oct 29. FEMS Microbiol Lett. 2008. PMID: 19016872
-
Medicago truncatula Gaertn. as a model for understanding the mechanism of growth promotion by bacteria from rhizosphere and nodules of alfalfa.Planta. 2016 May;243(5):1169-89. doi: 10.1007/s00425-016-2469-7. Epub 2016 Feb 10. Planta. 2016. PMID: 26861677 Free PMC article.
-
Pseudomonas fluorescens C7R12 type III secretion system impacts mycorrhization of Medicago truncatula and associated microbial communities.Mycorrhiza. 2017 Jan;27(1):23-33. doi: 10.1007/s00572-016-0730-3. Epub 2016 Aug 22. Mycorrhiza. 2017. PMID: 27549437
-
Synthesis and modeling perspectives of rhizosphere priming.New Phytol. 2014 Jan;201(1):31-44. doi: 10.1111/nph.12440. Epub 2013 Aug 19. New Phytol. 2014. PMID: 23952258 Review.
-
The Multiple Faces of the Medicago-Sinorhizobium Symbiosis.Methods Mol Biol. 2018;1822:241-260. doi: 10.1007/978-1-4939-8633-0_16. Methods Mol Biol. 2018. PMID: 30043308 Review.
Cited by
-
Priority effects alter interaction outcomes in a legume-rhizobium mutualism.Proc Biol Sci. 2021 Mar 10;288(1946):20202753. doi: 10.1098/rspb.2020.2753. Epub 2021 Mar 10. Proc Biol Sci. 2021. PMID: 33715440 Free PMC article.
-
Biopriming of Pseudomonas aeruginosa Abates Fluoride Toxicity in Oryza sativa L. by Restricting Fluoride Accumulation, Enhancing Antioxidative System, and Boosting Activities of Rhizospheric Enzymes.Plants (Basel). 2025 Apr 16;14(8):1223. doi: 10.3390/plants14081223. Plants (Basel). 2025. PMID: 40284110 Free PMC article.
-
Carbon fluxes and environmental interactions during legume development, with a specific focus on Pisum sativum.Physiol Plant. 2022 May;174(3):e13729. doi: 10.1111/ppl.13729. Physiol Plant. 2022. PMID: 35662039 Free PMC article. Review.
References
-
- van der Heijden MGA, Bardgett RD, van Straalen NM (2008) The unseen majority: soil microbes as drivers of plant diversity and productivity in terrestrial ecosystems. Ecol Lett 11: 296–310. - PubMed
-
- Vance CP, Heichel GH (1991) Carbon in N2 fixation: limitation or exquisite adaptation. Annu Rev Plant Phys 42: 373–392.
-
- Young ND, Mudge JE, Ellis THN (2003) Legume genomes: more than peas in a pod. Curr Opin Plant Biol 6: 199–204. - PubMed
-
- Douglas AE (2008) Conflict, cheats and the persistence of symbioses. New Phytol 177: 849–858. - PubMed
Publication types
MeSH terms
Substances
LinkOut - more resources
Full Text Sources
