. 2012;7(9):e45783.
doi: 10.1371/journal.pone.0045783. Epub 2012 Sep 24.

Controlled ultrasound-induced blood-brain barrier disruption using passive acoustic emissions monitoring

Affiliations

Controlled ultrasound-induced blood-brain barrier disruption using passive acoustic emissions monitoring

Costas D Arvanitis et al. PLoS One. 2012.

Abstract

The ability of ultrasonically-induced oscillations of circulating microbubbles to permeabilize vascular barriers such as the blood-brain barrier (BBB) holds great promise for noninvasive targeted drug delivery. A major issue has been a lack of control over the procedure to ensure both safe and effective treatment. Here, we evaluated the use of passively-recorded acoustic emissions as a means to achieve this control. An acoustic emissions monitoring system was constructed and integrated into a clinical transcranial MRI-guided focused ultrasound system. Recordings were analyzed using a spectroscopic method that isolates the acoustic emissions caused by the microbubbles during sonication. This analysis characterized and quantified harmonic oscillations that occur when the BBB is disrupted, and broadband emissions that occur when tissue damage occurs. After validating the system's performance in pilot studies that explored a wide range of exposure levels, the measurements were used to control the ultrasound exposure level during transcranial sonications at 104 volumes over 22 weekly sessions in four macaques. We found that increasing the exposure level until a large harmonic emissions signal was observed was an effective means to ensure BBB disruption without broadband emissions. We had a success rate of 96% in inducing BBB disruption as measured by in contrast-enhanced MRI, and we detected broadband emissions in less than 0.2% of the applied bursts. The magnitude of the harmonic emissions signals was significantly (P<0.001) larger for sonications where BBB disruption was detected, and it correlated with BBB permeabilization as indicated by the magnitude of the MRI signal enhancement after MRI contrast administration (R(2) = 0.78). Overall, the results indicate that harmonic emissions can be a used to control focused ultrasound-induced BBB disruption. These results are promising for clinical translation of this technology.


Conflict of interest statement

Competing Interests: A pending patent (#21379) on the method presented (US Provisional application # 61/548,274 filed on October 18, 2011.) The focused ultrasound system was supplied by InSightec. There are no further products in development or marketed products to declare. This does not alter the authors' adherence to all the PLoS ONE policies on sharing data and materials, as detailed online in the guide for authors.

Figures

Figure 1
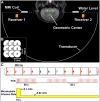
Figure 1. Experimental setup and methods.
(A) Coronal T2-weighted MRI of a monkey obtained during one of the experiments. The image has been annotated to show the location of the 30 cm diameter hemisphere transducer, the two transducers that served as receivers to monitor the acoustic emissions, and the MRI surface coil. The annotations were drawn to scale with the location of the brain in a typical position. (B) Beam steering pattern used during the multi-target sonications. The order of the sonications delivered is indicated. (C) Pulsing scheme used during the multi-target sonications. Each 10 ms burst was applied in sequence to the different subsonication targets every 200 ms. The pattern was repeated every 1.8 s, resulting in a pulse repetition frequency at each target of 0.55 Hz. Three 50 s sonications were delivered in series using this pattern, with a 25 second delay between sonications. The microbubbles were administered as an infusion that was started at the beginning of the each multi-target sonication, as indicated. This infusion was delivered at a variable rate in order to quickly reach a steady-state microbubble concentration in the tissue and maintain it throughout the entire sonication.
Figure 2
Figure 2. Acoustic emissions over a wide range of exposure levels.
(A) Typical power spectra showing spectra with and without broadband emission. The emissions recorded during sonication with microbubbles were normalized to baseline data obtained during identical sonications without microbubbles according to Eq. 2. Wideband emission was observed as signal detected around 610 kHz (arrow), the resonant frequency of our receiving transducers. (B) Mean acoustic emissions signal (± S.D.) as a function of the estimated pressure amplitude in the brain for harmonic, ultraharmonic and broadband emissions obtained in monkey #1 during a sonication where bursts were applied sequentially at increasing pressure amplitudes. Between 200–400 kPa, the harmonic signal strength increased linearly as a function of pressure amplitude (R2 = 0.92). The harmonic signal increase per kPa was 0.14±0.01 Np·Hz/kPa. The average signals from four bursts at each pressure amplitude are shown (mean ± SD shown). The arrows indicate the lowest pressures where the harmonic and broadband signals were observed with an SNR greater than 3. Broadband and ultraharmonic emissions were only observed in these locations when the harmonic emissions were greater than 20 Np·Hz.
Figure 3
Figure 3. Acoustic emissions, MRI, and histology at different exposure levels.
(A) Acoustic emissions, recorded during three single-target sonications delivered to the cingulate cortex in monkey #2, showing the largest broadband emissions for these sonications (arrow). Only locations 2 and 3 exhibited strong harmonic emissions (harmonic signal strength: 4.1, 17.9 and 25.8 Np·Hz, for locations 1–3, respectively) and resulted in contrast enhancement in MRI. Broadband emissions with an SNR greater than 3 were present at location 3 and at a much lower level at location 2, but not at location 1. The estimated pressure amplitudes in the brain were 175 kPa at location 1 and 275 kPa at locations 2–3. (B) T2*-weighted image acquired shortly after the sonications. A hypointense spot is only evident at location 3. (C) Light microscopy showing no petechaie or other changes at location 1. Tiny petechaie were found in the choroid plexus, (in the lateral ventricle) which was just inferior to location 2. It is possible that any changes in MRI resulting from petechaie at this location were missed because they occurred in the ventricle, which appears hypointense in our T2*-weighted imaging. Extensive petechaie were evident in histology at location 3. These petechaie covered a region 3 mm in diameter, similar to the half-intensity beam width of the focal zone of this TcMRgFUS device.
Figure 4
Figure 4. Example acoustic emissions and MRI for a multi-target sonication centered on the LGN in monkey #3.
(A) Harmonic emission signal strength as a function of time (212 kPa; Mean: mean signal ± S.D. for the nine subsonications; Min./Max.: subsonications with smallest and largest signals). The increase in emissions due to the arrival of the microbubbles at about 20 s is evident. Note also the constant level of emissions over the duration of the rest of the sonication. Harmonic emissions greater than zero at time = 0 were presumably due to microbubbles present in the circulation from an earlier sonication. (B) Relative power spectra averaged between 25–140 s showing strong harmonic emissions without evident broadband emissions. (C) T2-weighted image showing the location of the sonication. (D) MRI contrast enhancement observed in T1-weighted MRI after Gd-DTPA injection (percent enhancement shown). The subsonication targets are indicated (‘+’ subsonication target with strongest signals; ‘−’ target with smallest signals; ‘*’ others).
Figure 5
Figure 5. Harmonic emissions predict BBB disruption and safety limits.
(A) Maximum harmonic emission signal strength achieved during 104 multi-target sonications that did and did not result in MRI contrast enhancement. Sonication at different tissue structures produced different levels of harmonic emissions (*P<0.05; ***P<0.001). The greatest harmonic emissions were measured during sonication in the visual cortex. Contrast enhancement was always observed when the harmonic signal strength was 6 Np·Hz or higher. (B–D) Broadband emission plotted as a function of harmonic signal strength for 1026 subsonication targets in the three tissue structures. Red symbols indicate subsonications where the SNR of the broadband emissions signals was greater than 3. Such emissions were only observed in sonications in the visual cortex, and with one exception, only occurred when the harmonic emissions strength was greater than 20 Np·Hz.
Figure 6
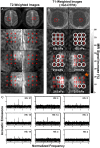
Figure 6. Comparison of harmonic emissions and MRI contrast enhancement at individual subsonications during six multi-target sonications in the cingulate cortex in monkey #4.
(A) Axial T2-weighted FSE images showing the location of the subsonication targets, which included the cingulate cortex and adjacent white matter. Gray matter is bright compared to white matter in these images. (B) Images showing the percent increase in MRI signal after Gd-DTPA injection and the harmonic emission measurements (in Np·Hz) noted at each subsonication target. Targets where the SNR of the harmonic emissions was less than 3 (circled) did not result in detectable MRI contrast enhancement. The magnitude of the emissions agreed qualitatively with that of the contrast enhancement. Little or no contrast enhancement or harmonic emission was observed in subsonications that were targeted in white matter. (scale bar: percent MRI signal increase after Gd-DTPA injection). (C) Spectra showing only harmonic emissions at each subsonication for the multi-target sonication in (A) noted with an orange “*”. The harmonic emissions signal strength (HS) is noted for each subsonication.
Figure 7
Figure 7. MRI signal enhancement after Gd-DTPA injection plotted as a function of the harmonic emissions signal strength.
Data are shown for individual subsonication targets delivered in the cingulate cortex in monkeys #4 and #6. The MRI enhancement was found in a 3×3 voxel ROI centered on the subsonication target. The MRI signal increased nonlinearly as a function of the strength of the harmonic emission. A good correlation (R2: 0.78) was found in a fit of the data to an exponential (solid line; dotted lines: 95% confidence intervals). Data shown are for the subsonication target that exhibited the greatest MRI signal enhancement for each of 28 multi-target sonications that were performed in the cingulate cortex in this study and included results from experiments where a second sonication was applied at either a higher power level or with an increased microbubble dose.
Figure 8
Figure 8. Sonication optimization.
(A) Example where the pressure amplitude was increased by 10 kPa at select subsonications in a visual cortex sonication in monkey #4. The harmonic emissions achieved during the first and second sonications (in Np·Hz) are noted for each subsonication target. Two of five targets that were sonicated twice overlapped with a sulcus (red circles) and showed a large increase in harmonic emissions with the second sonication. From the other targets only one showed significant increase (circled). (B) Similar experiment performed in the cingulate cortex in monkey #5. In this example the pressure amplitude was increased by 15 kPa for the second sonication. Three of the locations showed a strong increase in harmonic emissions (circled). (C) Similar experiment performed in the cingulate cortex in monkey #5, but instead of increasing the pressure amplitude, the second sonication used five times the microbubble dose (circles indicate the most pronounced increase in harmonic emissions). Arrows indicate strong contrast enhancement at the targets with pronounced increase in the harmonic emissions (Left images: T2-weighted images showing the location of the targeted volumes and the ROI; Right images: images showing contrast enhancement in T1-weighted images after Gd-DTPA injection).
Figure 9
Figure 9. Increase in harmonic emissions strength with increased microbubble dose.
Individual subsonications with low harmonic emissions signals were sonicated again with five times the microbubble dose. Signals recorded during the second sonication increased substantially; all but one increased to a level above 6 Np·Hz, a level where MRI-evident BBB disruption is expected based on results in Fig. 5. The two measurements were correlated (R2: 0.65). The measured slope indicates that the strength of the harmonic emissions is proportional to the number of oscillating microbubbles, since the signals were log-transformed (Eq. 3, log(5) = 1.6). A non-zero Y-intercept suggests that there may have been low-level harmonic emissions during the first sonication that were below our detection threshold.

References

    1. Pardridge WM (2007) Drug targeting to the brain. Pharm Res 24: 1733–1744. - PubMed
    1. Bobo RH, Laske DW, Akbasak A, Morrison PF, Dedrick RL, et al. (1994) Convection-enhanced delivery of macromolecules in the brain. Proc Natl Acad Sci U S A 91: 2076–2080. - PMC - PubMed
    1. Kroll RA, Neuwelt EA (1998) Outwitting the blood-brain barrier for therapeutic purposes: osmotic opening and other means. Neurosurgery 42: 1083–1099; discussion 1099–1100. - PubMed
    1. Doolittle ND, Miner ME, Hall WA, Siegal T, Jerome E, et al. (2000) Safety and efficacy of a multicenter study using intraarterial chemotherapy in conjunction with osmotic opening of the blood-brain barrier for the treatment of patients with malignant brain tumors. Cancer 88: 637–647. - PubMed
    1. Pardridge WM (2007) Blood-brain barrier delivery. Drug Discov Today 12: 54–61. - PubMed

Publication types