. 2012;7(9):e45829.
doi: 10.1371/journal.pone.0045829. Epub 2012 Sep 21.

Mitochondrial fusion is essential for steroid biosynthesis

Affiliations

Mitochondrial fusion is essential for steroid biosynthesis

Alejandra Duarte et al. PLoS One. 2012.

Abstract

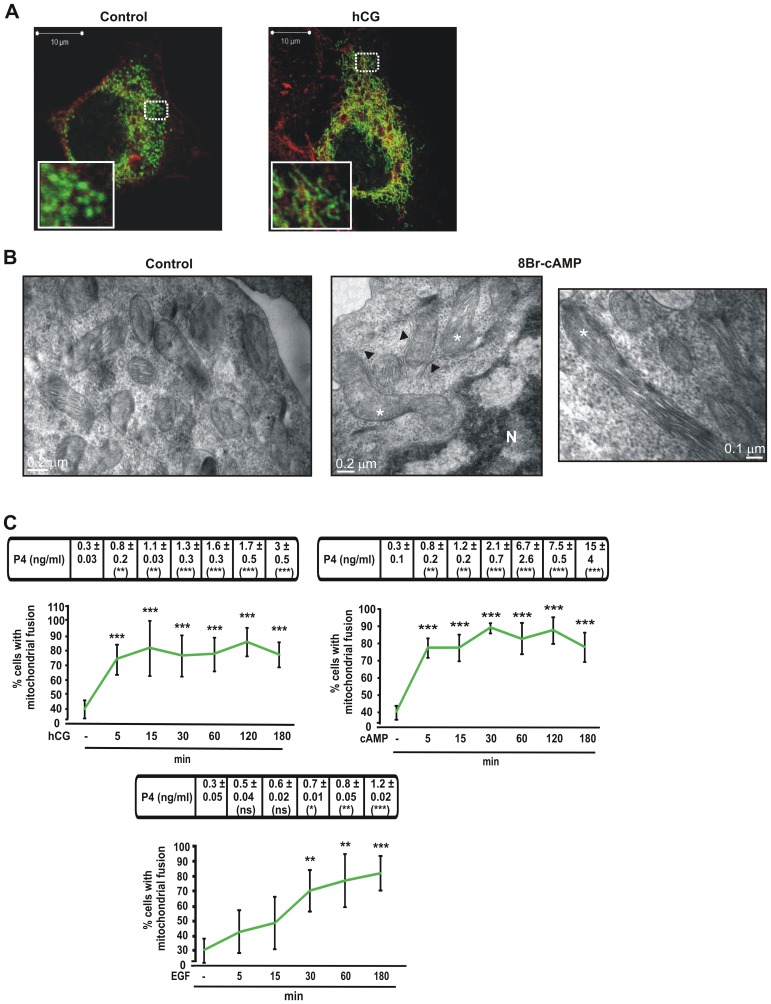
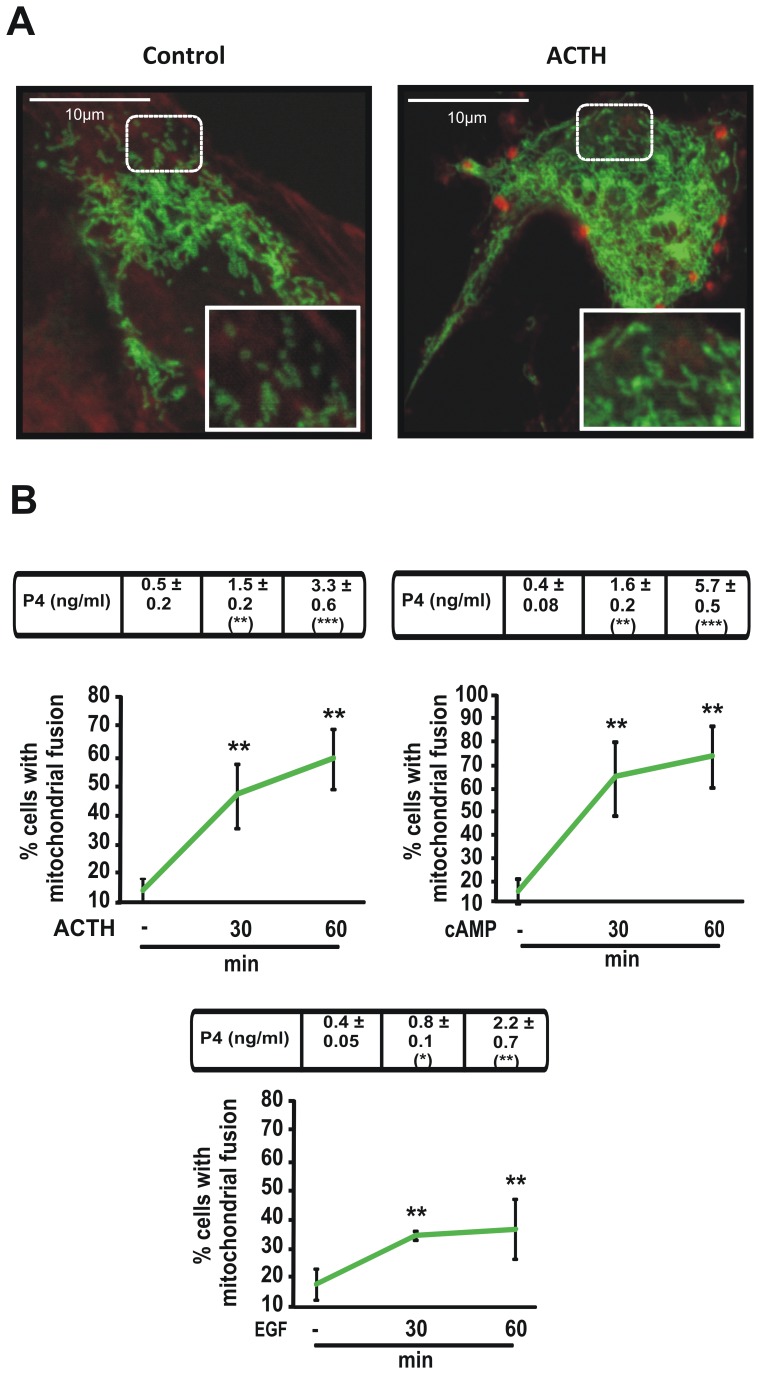
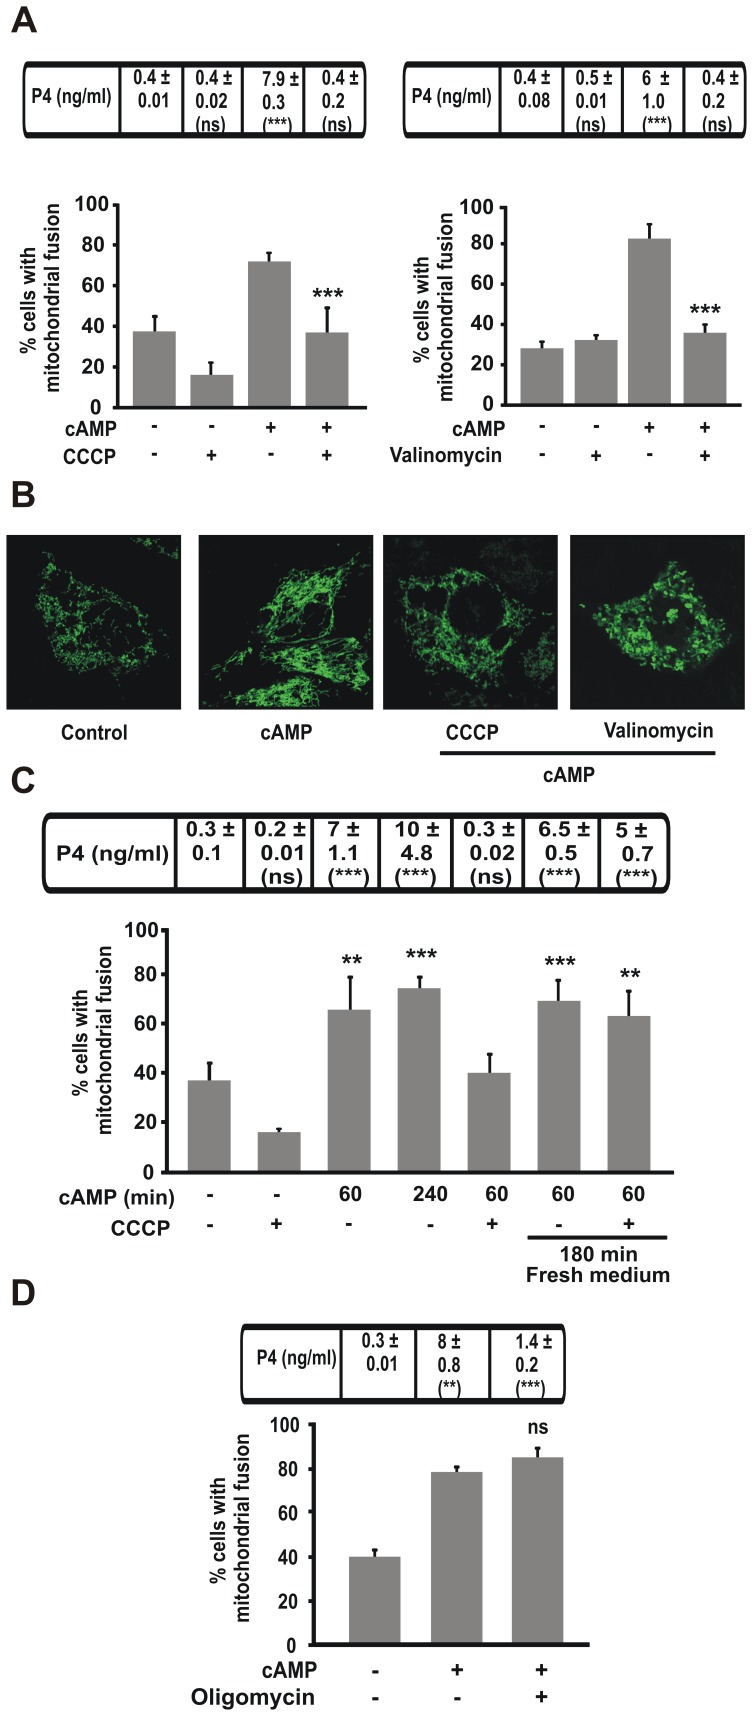
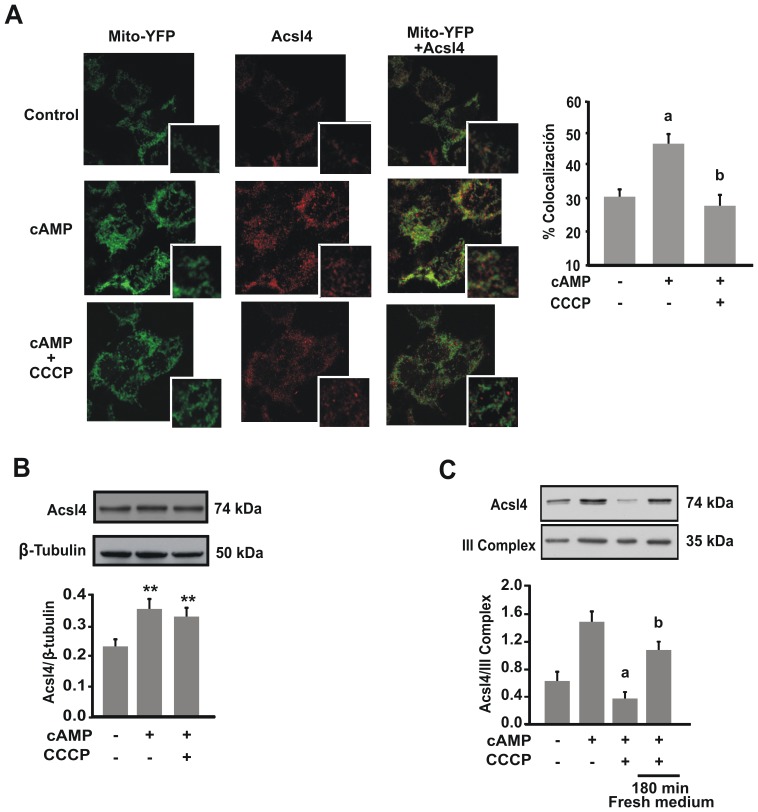
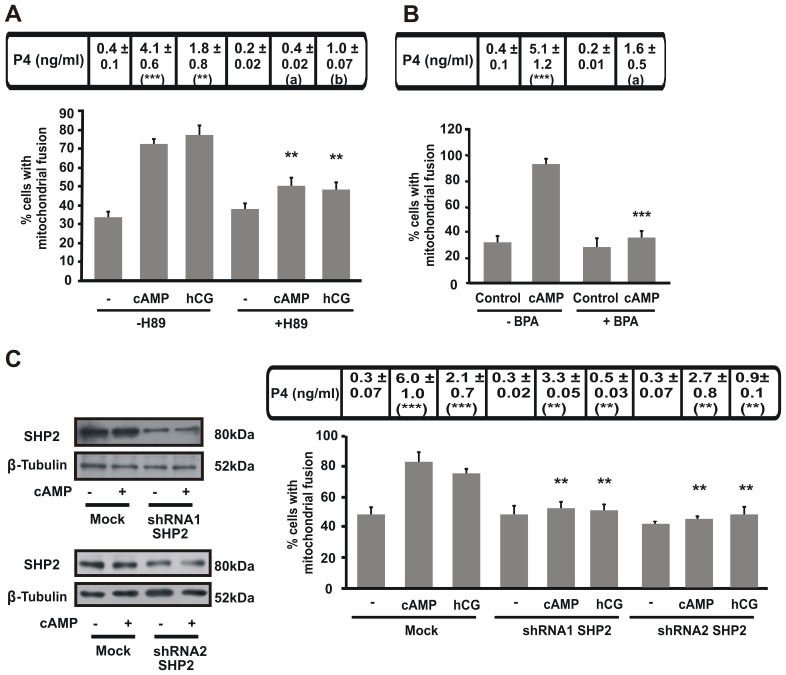
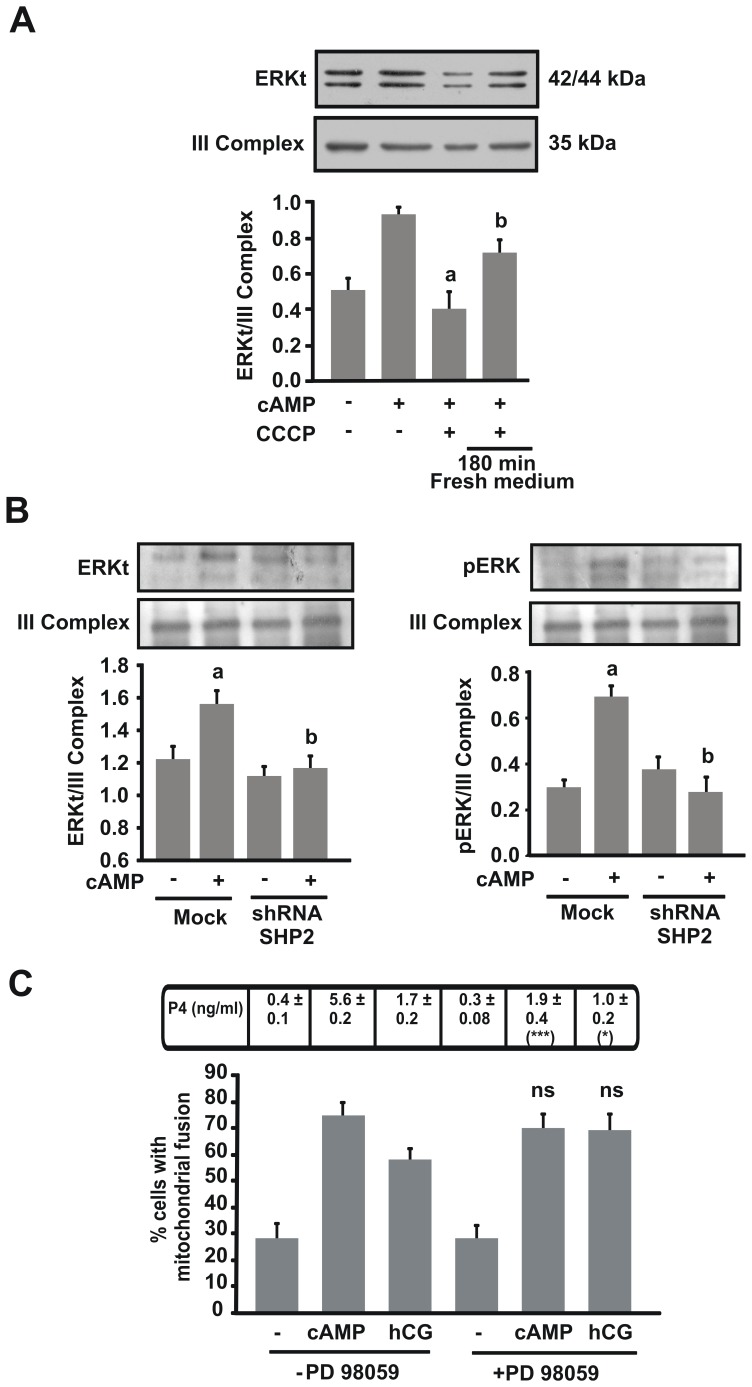
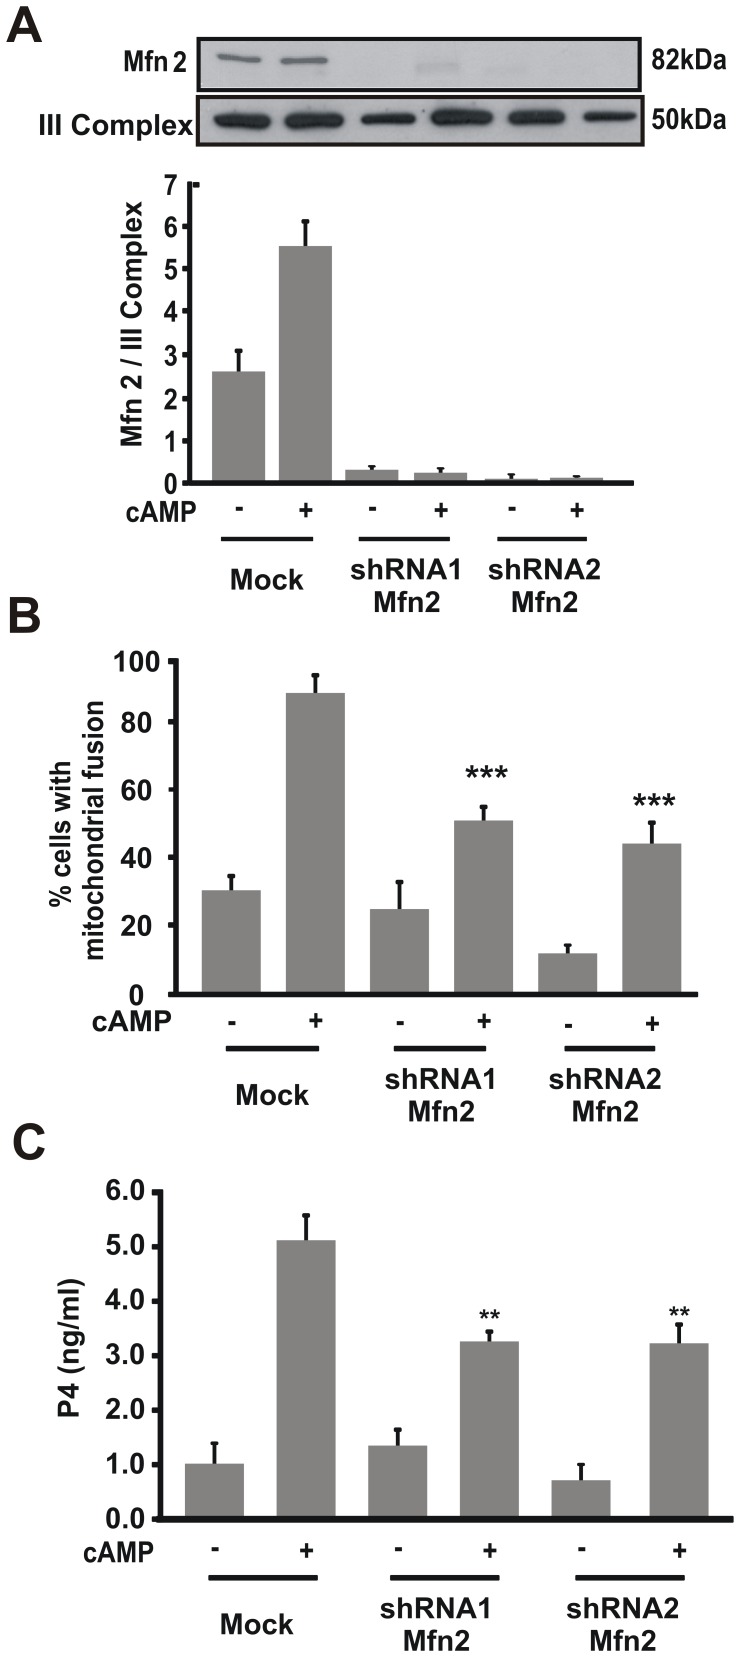
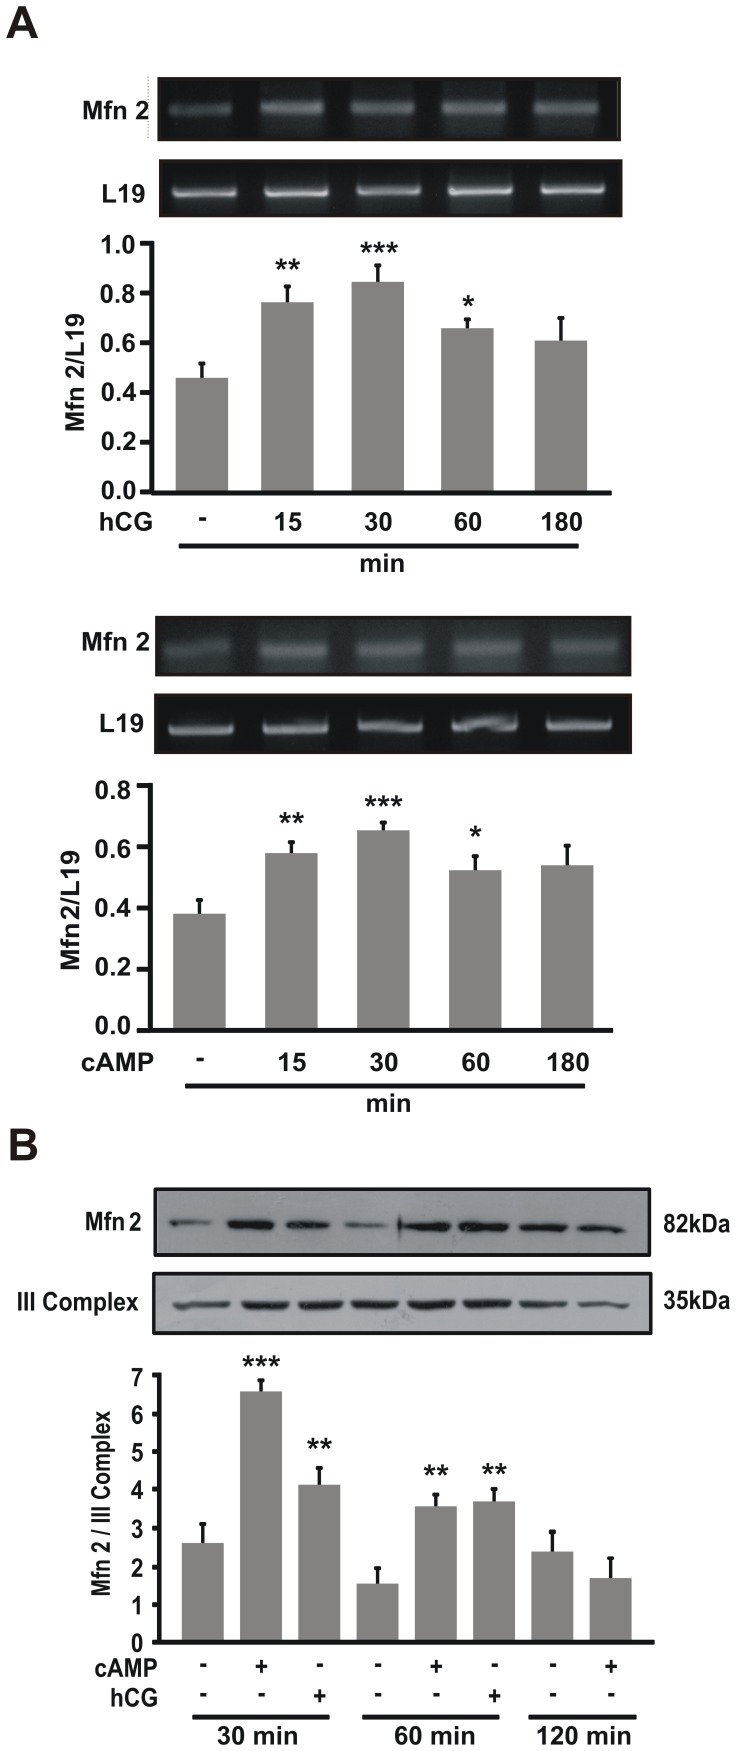
Although the contribution of mitochondrial dynamics (a balance in fusion/fission events and changes in mitochondria subcellular distribution) to key biological process has been reported, the contribution of changes in mitochondrial fusion to achieve efficient steroid production has never been explored. The mitochondria are central during steroid synthesis and different enzymes are localized between the mitochondria and the endoplasmic reticulum to produce the final steroid hormone, thus suggesting that mitochondrial fusion might be relevant for this process. In the present study, we showed that the hormonal stimulation triggers mitochondrial fusion into tubular-shaped structures and we demonstrated that mitochondrial fusion does not only correlate-with but also is an essential step of steroid production, being both events depend on PKA activity. We also demonstrated that the hormone-stimulated relocalization of ERK1/2 in the mitochondrion, a critical step during steroidogenesis, depends on mitochondrial fusion. Additionally, we showed that the SHP2 phosphatase, which is required for full steroidogenesis, simultaneously modulates mitochondrial fusion and ERK1/2 localization in the mitochondrion. Strikingly, we found that mitofusin 2 (Mfn2) expression, a central protein for mitochondrial fusion, is upregulated immediately after hormone stimulation. Moreover, Mfn2 knockdown is sufficient to impair steroid biosynthesis. Together, our findings unveil an essential role for mitochondrial fusion during steroidogenesis. These discoveries highlight the importance of organelles' reorganization in specialized cells, prompting the exploration of the impact that organelle dynamics has on biological processes that include, but are not limited to, steroid synthesis.


Conflict of interest statement

Competing Interests: The authors have declared that no competing interests exist.

Figures

Figure 1
Figure 1. Hormonal stimulation causes an increase in fused mitochondria morphology in MA-10 cells.
A. Representative confocal images of the MA-10 cell line transfected with mtYFP (mito, Green). After 24 h transfection, cells were stimulated with or without hCG (20 ng/ml) for 1 h. Cell morphology was visualized by actin red staining with the fluorescence dye Phalloidin–TRITC (1∶2000), incubated for 1 h at room temperature. Scale bar, 10 µm. B. Representative Electron micrographs of mitochondria in MA-10 cells. Cells were stimulated with or without 8Br-cAMP (1 mM) for 1 h. Scale bars, 0.2 µm. Higher magnification of another section is shown for 8Br-cAMP-treated cells (left panel). Scale bar; 0.1 µm. Asterisks indicate tubular, elongated mitochondria. Arrowheads indicate ER. C. After 24 h transfection with mt-YFP, MA-10 cells were treated with or without hCG (20 ng/ml), 8Br-cAMP (1 mM) or EGF (10 ng/ml), for the indicated times. Cells were processed as described in materials and methods and observed with a fluorescence microscope. Cells with the indicated mitochondrial morphology shown in right image of panel A, named as mitochondrial fusion in the graphics, were quantified. More than a hundred cells were counted manually in at least four distinct optical fields. Quantitative analysis of fused mitochondria is shown. Results are expressed as the means ± SEM of three independent experiments. ***P<0.001 vs. control. **P<0.01 vs. control. Cellular medium was used to determine P4 production by RIA. Results of P4 measurement are indicated at the top of each graph as the means ± SEM of three independent experiments. ns P>0.05 vs. control. ***P<0.001 vs. control. **P<0.01 vs. control.
Figure 2
Figure 2. Hormonal stimulation causes an increase in fused mitochondria morphology in Y1 cells. A.
Representative confocal images of Y1 cell line transfected with mtYFP. After 24 h transfection, cells were stimulated with or without ACTH (2 UI/ml) for 1 h. Cell morphology was visualized by actin red staining with the fluorescence dye Phalloidin–TRITC (1∶2000), incubated for 1 h at room temperature. Scale bar, 10 µm. B. After 24 h transfection with mt-YFP, Y1 cells were treated with or without ACTH (2 UI/ml), 8Br-cAMP (1 mM) or EGF (10 ng/ml), at the indicated times. See comments in Figure 1. Results of P4 measurement are indicated at the top of each graph as the means ± SEM of three independent experiments. *P<0.05 vs. control. ***P<0.001 vs. control. **P<0.01 vs. control.
Figure 3
Figure 3. Mitochondrial membrane potential affects linearly fused mitochondria in MA-10 cells after hormonal stimulation.
MA-10 cells were transfected with mt-YFP and 24 h post-transfection treated as described in each panel. Cells were scored and mitochondrial shapes were determinated. Quantitative analysis of fused mitochondrial shape is shown. A. Cells were treated with or without CCCP (5 µM) (left panel) or valinomycin (1 µM) (right panel) and 8Br-cAMP (1 mM) for 1 h. The results are expressed as the means ± SEM of three independent experiments. ***P<0.001 vs. control. B. Representative confocal images of mitochondrial shape in MA-10 cells treated with or without CCCP (5 µM) or valinomycin (1 µM) and 8Br-cAMP (1 mM) for 1 h. Scale bar, 10 µm. C. Cells were treated with or without CCCP (5 µM) and 8Br-cAMP (1 mM) for 1 h, or incubation with CCCP and 8Br-cAMP for 1 h followed by washout and 3 h recovery. The results are expressed as the means ± SEM of three independent experiments. **P<0.01 vs. control. ***P<0.001 vs. control. D. Cells were treated with or without oligomycin (1 µM) and 8Br-cAMP (1 mM) for 1 h. The results are expressed as the means ± SEM of three independent experiments. ns P>0.05 vs. 8Br-cAMP. Cellular medium was used to determine P4 production by RIA. Results of P4 measurement are indicated at the top of each graph as the means ± SEM of three independent experiments. ns P>0.05 vs. control. ***P<0.001 vs. control. **P<0.01 vs. control.
Figure 4
Figure 4. Hormonal stimulation allows an association between mitochondria and the MAM. A.
After 24 hour transfection with mt-YFP (green), MA-10 cells were treated with or without CCCP (5 µM) and 8Br-cAMP (1 mM) for 1 h. Representative immunofluorescence to confocal section of co-localization between mitochondria and the MAM (Left panel). The MAM was stained with Acsl4 polyclonal antibody (red) followed by secondary antibody conjugated with Cy3 fluorofore as described in materials and methods. Signal overlap was quantified using MBF-Image J (Right panel). Pearsońs colocalization coefficients were calculated from three independent experiments and then converted to percentages. Data represent means ± SEM. a P<0.001 vs. control and b P<0.001 vs. 8Br-cAMP. B. MA-10 cells were treated with or without CCCP (5 µM) and 8Br-cAMP (1 mM) for 1 h. Total proteins were obtained and western blotting was performed. An image of a representative western blot is shown. Membranes were sequentially blotted with anti-Acsl4 and anti-β-tubulin antibodies. For each band, the optical density (OD) of the expression levels of Acsl4 protein was quantified and normalized to the corresponding β-tubulin protein. The relative levels of Acsl4 protein are shown. Data are presented as an average SEM of three independent experiments. **P<0.01 vs. control. C. MA-10 Cells were treated with or without CCCP (5 µM) and 8Br-cAMP (1 mM) for 1 h, or incubation with CCCP and 8Br-cAMP for 1 h followed by washout and 3 h recovery. Mitochondria were isolated and western blotting was performed. An image of a representative western blot is shown. Membranes were sequentially blotted with anti-Acsl4 and anti-OxPhos complex III core 2 subunit (III Complex) antibodies. For each band, the OD of the expression levels of Acsl4 protein was quantified and normalized to the corresponding III Complex protein. The relative levels of Acsl4 protein are shown. Data are presented as an average SEM of three independent experiments. a P<0.001 vs. 8Br-cAMP and b P<0.001 vs. control.
Figure 5
Figure 5. PKA activity induces mitochondrial fusion in steroid synthesis.
MA-10 cells were transfected with mt-YFP and 24 h post-transfection treated as described for each panel. For each point, 100 cells were scored and mitochondrial shapes were classified. Quantitative analysis of fused mitochondria was shown. A. Cells were treated with or without H89 (20 µM) and stimulated with hCG (20 ng/ml) or 8Br-cAMP (1 mM) for 1 h. The results are expressed as the means ± SEM of three independent experiments. **P<0.01 vs. 8Br-cAMP without H89. B. Cells were treated with or without BPA (20 µM) and 8Br-cAMP (1 mM) for 1 h. The results are expressed as the means ± SEM of three independent experiments. ***P<0.001 vs. cAMP without BPA. C. Left panel: MA-10 cells were transfected with a plasmid containing different shRNA SHP2 (shRNA1 or shRNA2). After 48 h, total proteins were obtained and western blotting was performed. Membranes were sequentially blotted with anti-SHP2 and anti-β-tubulin antibodies. An image of a representative western blot is shown to assess shRNA1 and 2 knockdown efficiency. Right panel: cells were transfected with the plasmid combination, the mt-YFP-empty vector, mt-YFP-shRNA1 or mt-YFP-shRNA2 and after 48 h, cells were fixed and mitochondrial shape scored. The results are expressed as the means ± SEM of three independent experiments. **P<0.01 vs. cAMP mock. *P<0.05 vs. hCG mock. Cellular medium was used to determine P4. Results of P4 measurement are indicated at the top of each graph as the means ± SEM of three independent experiments. ***P<0.001 vs. control. **P<0.01 vs. control, a P<0.001 vs. cAMP without H89 or BPA and b P<0.01 vs. hCG without H89.
Figure 6
Figure 6. Mitochondrial fusion could allow access of ERK into mitochondria. A.
MA-10 cells were treated with or without CCCP (5 µM) and 8Br-cAMP (1 mM) for 1 h, or incubation with CCCP and 8Br-cAMP for 1 h followed by washout and 3 h recovery. Mitochondria were isolated and western blotting was performed. An image of a representative western blot is shown (Top panel). Membranes were sequentially blotted with anti-ERKt and anti-III Complex antibodies. For each band, the OD of the expression levels of ERKt protein was quantified and normalized to the corresponding III Complex protein. The relative levels of ERKt protein are shown. Data are presented as an average SEM of three independent experiments. a P<0.001 vs. cAMP and b P<0.01 vs. control. B. Left panel: MA-10 cells were transfected with the shRNA1 SHP2 plasmid. After 48 h, mitochondria were isolated and western blotting was performed. An image of a representative western blot is shown. Membranes were sequentially blotted with anti-ERKt (total ERK) and anti-III Complex antibodies. For each band, the OD of the expression levels of ERKt protein was quantified and normalized to the corresponding III Complex protein. The relative levels of ERKt protein are shown. Right panel: an image of a representative western blot is shown. Membranes were incubated with a stripping buffer and blotted with anti-pERK (phosphorylated ERK). For each band, the OD of the expression levels of pERK protein was quantified and normalized to the corresponding III Complex protein. The relative levels of pERK protein are shown. The results are expressed as the means ± SEM of three independent experiments. a P<0.01 vs. Control and b P<0.01 vs. 8Br-cAMP mock. C. After 24 h transfection with mt-YFP, MA-10 cells were treated with or without PD98059 (50 µM) and stimulated with hCG (20 ng/ml) or 8Br-cAMP (1 mM) for 1 h. Cells were scored and mitochondrial shapes classified. The results are expressed as the means ± SEM of three independent experiments. ns P>0.05 vs. cAMP and hCG without inhibitor. Cellular medium was used to determine P4 production by RIA. Results of P4 measurement are indicated as the means ± SEM of three independent experiments. ***P<0.001 vs. cAMP without PD. *P<0.05 vs. hCG without PD.
Figure 7
Figure 7. Mfn2 protein is necessary for steroid synthesis.
MA-10 cells were transfected with a plasmid containing different shRNA Mfn2 (shRNA1 or shRNA2). After 48 h, cells were stimulated with 8Br-cAMP (0.5 mM) for 1 h. A. Isolated mitochondrial proteins were obtained and western blotting was performed. Membranes were sequentially blotted with anti-Mfn2 and anti-III Complex antibodies. An image of a representative western blot is shown. For each band, the OD of the expression levels of Mfn2 protein was quantified and normalized to the corresponding III Complex protein. The relative levels of Mfn2 protein are shown. B. Cells were fixed and scored as previously described. Quantitative analysis of mitochondrial fusion is shown. The results are expressed as the means ± SEM of three independent experiments. **P<0.01 vs. cAMP mock. C. P4 levels were determined by RIA in the incubation media. Data represent the means ± SEM of three independent experiments and expressed as ng/ml. **P<0.01 vs. 8Br-cAMP mock.
Figure 8
Figure 8. Hormonal stimulation induces Mfn2 expression.
MA-10 cells were treated with or without hCG (20 ng/ml) or 8Br-cAMP (1 mM) for the indicated times. A. Total RNA was isolated; reverse-transcribed, and subjected to semi-quantitative PCR using specific primers for Mfn2 and L19 cDNA as loading controls. PCR products were resolved in ethidium bromide-stained agarose gels. The figure shows representative gels. For each band, the OD of the expression levels of Mfn2 was quantified and normalized to the corresponding L19 abundance. The relative levels of Mfn2 are shown. The results are expressed as the means ± SEM of three independent experiments. **P<0.01 vs. control, ***P<0.001 vs. control, *P<0.05 vs. control. B. Mitochondria were isolated and western blotting was performed. An image of a representative western blot is shown. Membranes were sequentially blotted with anti-Mfn2 and III Complex antibodies. For each band, the OD of the expression levels of Mfn2 protein was quantified and normalized to the corresponding III Complex protein. The relative levels of Mfn2 protein are shown. The results are expressed as the means ± SEM of three independent experiments. ***P<0.001 vs. control. **P<0.01 vs. control.

Similar articles

Cited by

References

    1. Garren LD, Gill GN, Masui H, Walton GM (1971) On the mechanism of action of ACTH. Recent Prog Horm Res 27: 433–478. - PubMed
    1. Crivello JF, Jefcoate CR (1980) Intracellular movement of cholesterol in rat adrenal cells. Kinetics and effects of inhibitors. J Biol Chem 255: 8144–8151. - PubMed
    1. Privalle CT, Crivello JF, Jefcoate CR (1983) Regulation of intramitochondrial cholesterol transfer to side-chain cleavage cytochrome P-450 in rat adrenal gland. Proc Natl Acad Sci U S A 80: 702–706. - PMC - PubMed
    1. Rone MB, Fan J, Papadopoulos V (2009) Cholesterol transport in steroid biosynthesis: role of protein-protein interactions and implications in disease states. Biochim Biophys Acta 1791: 646–658. - PMC - PubMed
    1. Poderoso C, Converso DP, Maloberti P, Duarte A, Neuman I, et al. (2008) A mitochondrial kinase complex is essential to mediate an ERK1/2-dependent phosphorylation of a key regulatory protein in steroid biosynthesis. PLoS One 3: e1443. - PMC - PubMed

Publication types

MeSH terms

Substances