

Profiling the anaerobic response of C. elegans using GC-MS
- PMID: 23029411
- PMCID: PMC3459875
- DOI: 10.1371/journal.pone.0046140
Profiling the anaerobic response of C. elegans using GC-MS
Abstract
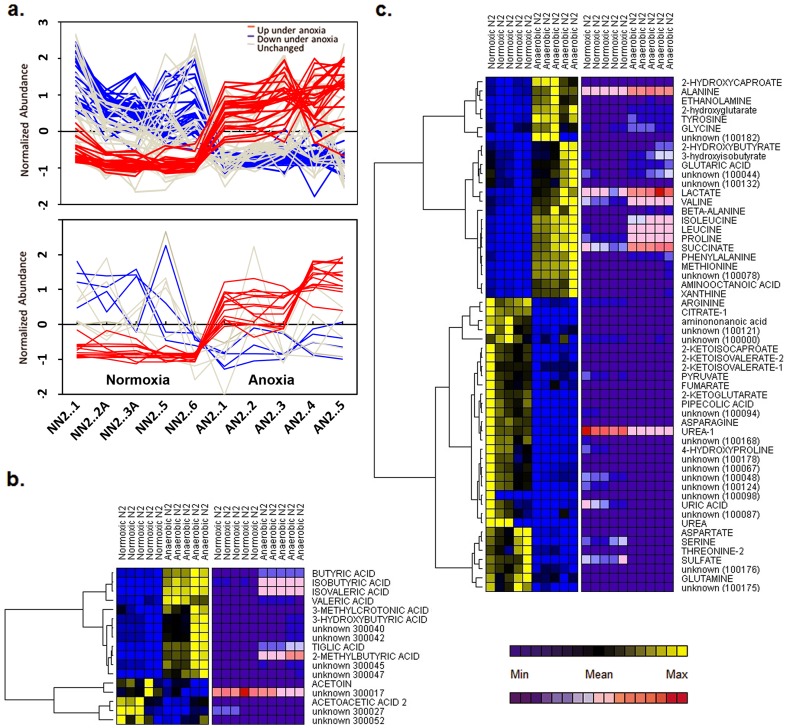
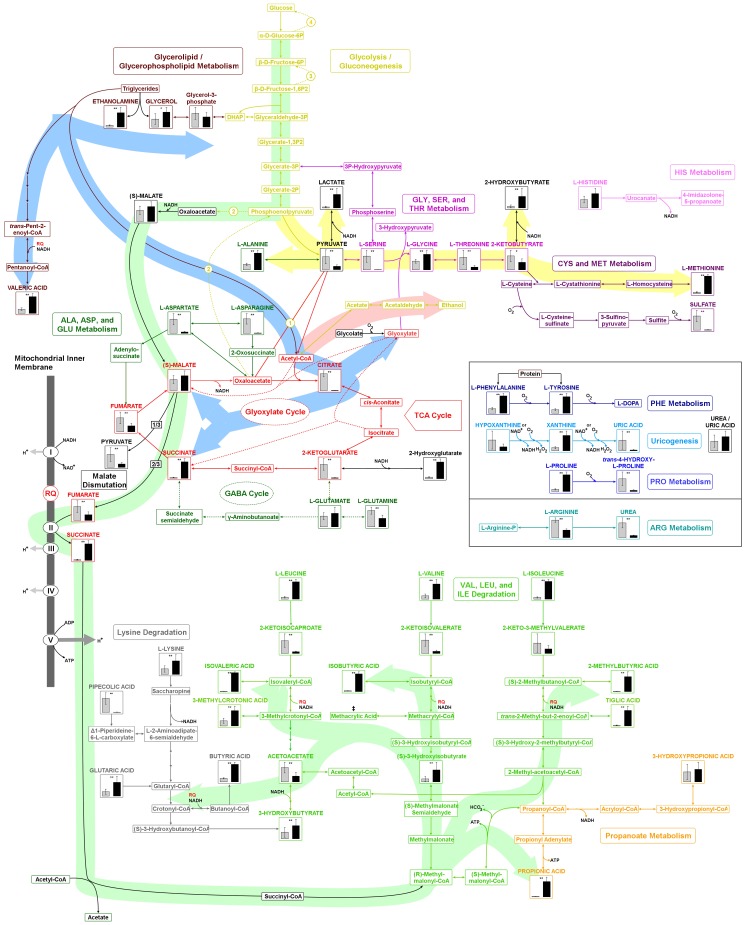
The nematode Caenorhabditis elegans is a model organism that has seen extensive use over the last four decades in multiple areas of investigation. In this study we explore the response of the nematode Caenorhabditis elegans to acute anoxia using gas-chromatography mass-spectrometry (GC-MS). We focus on the readily-accessible worm exometabolome to show that C. elegans are mixed acid fermenters that utilize several metabolic pathways in unconventional ways to remove reducing equivalents - including partial reversal of branched-chain amino acid catabolism and a potentially novel use of the glyoxylate pathway. In doing so, we provide detailed methods for the collection and analysis of excreted metabolites that, with minimal adjustment, should be applicable to many other species. We also describe a procedure for collecting highly volatile compounds from C. elegans. We are distributing our mass spectral library in an effort to facilitate wider use of metabolomics.
Conflict of interest statement
Figures
Similar articles
-
Ascaroside Profiling of Caenorhabditis elegans Using Gas Chromatography-Electron Ionization Mass Spectrometry.Anal Chem. 2017 Oct 3;89(19):10570-10577. doi: 10.1021/acs.analchem.7b02803. Epub 2017 Sep 21. Anal Chem. 2017. PMID: 28866881
-
Sample Preparation of Caenorhabditis elegans for GC-MS-Based Metabolomics in Toxicity Assessment.Methods Mol Biol. 2025;2895:271-297. doi: 10.1007/978-1-0716-4350-1_18. Methods Mol Biol. 2025. PMID: 39885036
-
Metabolomics reveals the perturbations in the metabolome of Caenorhabditis elegans exposed to titanium dioxide nanoparticles.Nanotoxicology. 2015;9(8):994-1004. doi: 10.3109/17435390.2014.993345. Epub 2015 Sep 4. Nanotoxicology. 2015. PMID: 25683258
-
Quo Vadis Caenorhabditis elegans Metabolomics-A Review of Current Methods and Applications to Explore Metabolism in the Nematode.Metabolites. 2021 Apr 29;11(5):284. doi: 10.3390/metabo11050284. Metabolites. 2021. PMID: 33947148 Free PMC article. Review.
-
The Caenorhabditis elegans lipidome: A primer for lipid analysis in Caenorhabditis elegans.Arch Biochem Biophys. 2016 Jan 1;589:27-37. doi: 10.1016/j.abb.2015.06.003. Epub 2015 Jun 10. Arch Biochem Biophys. 2016. PMID: 26072113 Review.
Cited by
-
The paradox of mitochondrial dysfunction and extended longevity.Exp Gerontol. 2014 Aug;56:221-33. doi: 10.1016/j.exger.2014.03.016. Epub 2014 Apr 1. Exp Gerontol. 2014. PMID: 24699406 Free PMC article. Review.
-
A Caenorhabditis elegans Genome-Scale Metabolic Network Model.Cell Syst. 2016 May 25;2(5):297-311. doi: 10.1016/j.cels.2016.04.012. Epub 2016 May 19. Cell Syst. 2016. PMID: 27211857 Free PMC article.
-
Nonmammalian models to study Clostridioides difficile infection; a systematic review.Anaerobe. 2023 Feb;79:102694. doi: 10.1016/j.anaerobe.2023.102694. Epub 2023 Jan 7. Anaerobe. 2023. PMID: 36626950 Free PMC article.
-
Modeling the metabolic interplay between a parasitic worm and its bacterial endosymbiont allows the identification of novel drug targets.Elife. 2020 Aug 11;9:e51850. doi: 10.7554/eLife.51850. Elife. 2020. PMID: 32779567 Free PMC article.
-
An anoxia-starvation model for ischemia/reperfusion in C. elegans.J Vis Exp. 2014 Mar 11;(85):51231. doi: 10.3791/51231. J Vis Exp. 2014. PMID: 24637332 Free PMC article.
References
-
- Yuan J, Horvitz HR (1990) The Caenorhabditis elegans genes ced-3 and ced-4 act cell autonomously to cause programmed cell death. Dev Biol 138: 33–41. - PubMed
Publication types
MeSH terms
Substances
LinkOut - more resources
Full Text Sources
Miscellaneous
