. 2012;7(9):e46484.
doi: 10.1371/journal.pone.0046484. Epub 2012 Sep 28.

Inhibition of fatty acid metabolism reduces human myeloma cells proliferation

Affiliations

Inhibition of fatty acid metabolism reduces human myeloma cells proliferation

José Manuel Tirado-Vélez et al. PLoS One. 2012.

Abstract

Multiple myeloma is a haematological malignancy characterized by the clonal proliferation of plasma cells. It has been proposed that targeting cancer cell metabolism would provide a new selective anticancer therapeutic strategy. In this work, we tested the hypothesis that inhibition of β-oxidation and de novo fatty acid synthesis would reduce cell proliferation in human myeloma cells. We evaluated the effect of etomoxir and orlistat on fatty acid metabolism, glucose metabolism, cell cycle distribution, proliferation, cell death and expression of G1/S phase regulatory proteins in myeloma cells. Etomoxir and orlistat inhibited β-oxidation and de novo fatty acid synthesis respectively in myeloma cells, without altering significantly glucose metabolism. These effects were associated with reduced cell viability and cell cycle arrest in G0/G1. Specifically, etomoxir and orlistat reduced by 40-70% myeloma cells proliferation. The combination of etomoxir and orlistat resulted in an additive inhibitory effect on cell proliferation. Orlistat induced apoptosis and sensitized RPMI-8226 cells to apoptosis induction by bortezomib, whereas apoptosis was not altered by etomoxir. Finally, the inhibitory effect of both drugs on cell proliferation was associated with reduced p21 protein levels and phosphorylation levels of retinoblastoma protein. In conclusion, inhibition of fatty acid metabolism represents a potential therapeutic approach to treat human multiple myeloma.


Conflict of interest statement

Competing Interests: The authors have read the journal’s policy and have the following conflicts: The inventions are protected by Spanish patent applications #P201130569 and #P201130570. This does not alter the authors’ adherence to all the PLOS ONE policies on sharing data and materials.

Figures

Figure 1
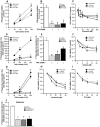
Figure 1. Effects of etomoxir and orlistat on fatty acid metabolism and cell viability in myeloma cell lines.
(A) Mitochondrial β-oxidation of exogenous fatty acids in myeloma cell lines. RPMI-8226, NCI-H929 and U-266B1 cells were preincubated with tritiated palmitate for 18 h for measurement of fatty acid oxidation rates. Data are represented as means ± SEM for four to six independent experiments for each cell line. *p<0.05 versus 50×103 cells. (B) Etomoxir inhibits mitochondrial β-oxidation in myeloma cells. RPMI-8226, NCI-H929 and U-266B1 cells were preincubated in the presence or absence of 50 µM etomoxir for 18 h and β-oxidation was determined as described in “Materials and Methods”. Data are represented as means ± SEM for four to six independent experiments for each cell line. *p<0.05 versus untreated cells. (C) Etomoxir reduces cell viability in myeloma cells. Cell viability was assessed after 18 h treatment with the indicated doses of etomoxir. Results are expressed as percentage of values in untreated cells (n = 4–6 independent experiments). *p<0.05 versus untreated cells. (D) De novo lipid synthesis from acetate as carbon source in myeloma cell lines. RPMI-8226, NCI-H929 and U-266B1 cells were preincubated with [14C]-acetate for 24 h for measurement of [14C]-acetate incorporation into total lipids. Data are represented as means ± SEM for four to six independent experiments for each cell line. *p<0.05 versus 50×103 cells. (E) Orlistat inhibits de novo lipogenesis in myeloma cells. RPMI-8226, NCI-H929 and U-266B1 cells were preincubated in the presence or absence of 20 µM orlistat for 24 h, and [14C]-acetate incorporation into total lipids was determined as described in “Materials and Methods” section. Data are represented as means ± SEM for four to six independent experiments for each cell line. *p<0.05 versus untreated cells. (F) Orlistat reduces cell viability in myeloma cells. Cell viability was assessed after 24 h treatment with indicated doses of orlistat. Results are expressed as percentage of values in untreated cells (n = 4–6 independent experiments). *p<0.05 versus untreated cells. (G) De novo lipid synthesis from glucose as carbon source in myeloma cell lines. RPMI-8226, NCI-H929 and U-266B1 cells were preincubated with [14C]-glucose for 24 h for measurement of [14C]-glucose incorporation into total lipids. Data are represented as means ± SEM for three independent experiments for each cell line. *p<0.05 versus 50×103 cells. (H) Cerulenin reduces cell viability in myeloma cells. Cell viability was assessed after 24 h treatment with indicated doses of cerulenin. Results are expressed as percentage of values in untreated cells (n = 9 independent experiments). *p<0.05 versus untreated cells. (I) C75 reduces cell viability in myeloma cells. Cell viability was assessed after 24 h treatment with indicated doses of C75. Results are expressed as percentage of values in untreated cells (n = 9 independent experiments). *p<0.05 versus untreated cells. (J) Cerulenin, C75 or orlistat inhibit de novo lipogenesis in myeloma cells. RPMI-8226 cells were preincubated in the presence or absence of 20 µM cerulenin, 20 µM C75 or 20 µM orlistat for 24 h and [14C]-glucose incorporation into total lipids was determined as described in “Materials and Methods” section. Data are represented as means ± SEM for nine independent experiments for each cell line. *p<0.05 versus untreated cells.
Figure 2
Figure 2. Effects of etomoxir and orlistat on glucose metabolism in myeloma cell lines.
Myeloma cells were preincubated in the presence or absence of 50 µM etomoxir or 20 µM orlistat for 18 h and 24 h respectively before measurement of glucose uptake, glycolysis, or lactate production as described in “Materials and Methods” section. Effects of etomoxir (A–C) or orlistat (D–F) on glucose metabolism in U-266B1 cells. Effects of etomoxir (G–I) or orlistat (J–L) on glucose metabolism in NCI-H929 cells. Effects of etomoxir (M–O) or orlistat (P–R) on glucose metabolism in RPMI-8226 cells. Data are represented as means ± SEM for four to six independent experiments in triplicate. *p<0.05 versus untreated cells.
Figure 3
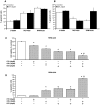
Figure 3. Etomoxir and orlistat inhibit cell cycle progression and decreased proliferation rate in myeloma cells.
The effect of etomoxir and orlistat on cell cycle phases was determined in myeloma cells preincubated in the presence or absence of 50 µM etomoxir or 20 µM orlistat for 18 or 24 hours respectively as described in “Materials and Methods” section. (A,B) Cell cycle phases in U-266B1 cells. (C,D) Cell cycle phases in NCI-H929 cells. Results are means ± SEM for 3 independent experiments in triplicate. *p<0.05 versus untreated cells. The effect of 50 µM etomoxir (E), 20 µM orlistat (F) on the proliferation rate in RPMI-8226, U-266B1 and NCI-H929 cells was determined by the incorporation of tritiated thymidine assay. Results are means ± SEM for 3–6 independent experiments in triplicate. *p<0.05 versus untreated cells. The effect of 50 µM etomoxir, 20 µM orlistat or the combination of both drugs on the proliferation rate in U-266B1 cells (G) and RPMI-8226 cells (H) was determined by the incorporation of tritiated thymidine assay. Results are means ± SEM for 3–6 independent experiments in triplicate. *p<0.05 versus untreated cells. #p<0.05 versus etomoxir and orlistat treated cells.
Figure 4
Figure 4. Orlistat enhances the apoptotic effect of bortezomib in RPMI-8266 cells.
The effect of etomoxir (A) or orlistat (B) on apoptosis in U-266B1, NCI-H929 and RPMI-8226 cells was determined by FACS analysis of intracellular cleaved-caspase-3 levels. Cells were preincubated in the presence or absence of 50 µM etomoxir or 20 µM orlistat for 18 h and 24 h respectively, and cleaved-caspase-3 levels were analyzed as described in the “Materials and Methods” section. Results are means ± SEM for 3 independent experiments in triplicate. *p<0.05 versus untreated cells. (C) The effect of etomoxir, orlistat or bortezomib on cell viability was analyzed in RPMI-8226 cells. Cells were preincubated in the presence or absence of 50 µM etomoxir, 20 µM orlistat or 20 µM bortezomib for 24 hours. Afterwards, cell viability was determined as described in the “Materials and Methods” section. Results are means ± SEM for 6 independent experiments in triplicate. *p<0.05 versus untreated cells. #p<0.05 versus orlistat or etomoxir alone. (D) The effect of etomoxir, orlistat or bortezomib on apoptosis was analyzed in RPMI-8226 cells. Cells were preincubated as described above. Afterwards, the percentage of apoptotic cells was determined by FACS analysis of intracellular cleaved-caspase-3 levels as described above. Results are means ± SEM for 6 independent experiments in triplicate. *p<0.05 versus untreated cells. #p<0.05 versus orlistat or etomoxir alone.
Figure 5
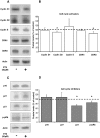
Figure 5. Effects of etomoxir on cell cycle regulatory proteins in myeloma cells.
Western blot analysis of cell cycle regulatory proteins from etomoxir-treated myeloma cells. Cells were treated in the presence or absence of 50 µM etomoxir for 18 hours before harvesting the cells, preparation of cell extracts and detection of proteins by specific antibodies. Representative immunoblot of cell cycle activators (A) and inhibitors (C). Quantification of the total data set expressed as percentage of untreated cells (B, D). Mean ± SEM for 4–6 independent experiments. *p<0.05 versus untreated cells.
Figure 6
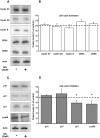
Figure 6. Effects of orlistat on cell cycle regulatory proteins in myeloma cells.
Western blot analysis of cell cycle regulatory proteins from orlistat-treated myeloma cells. Cells were treated in the presence or absence of 20 µM orlistat for 24 hours before harvesting the cells, preparation of cell extracts and detection of proteins by specific antibodies. Representative immunoblot of cell cycle activators (A) and inhibitors (C). Quantification of the total data set expressed as percentage of control (B, D). Mean ± SEM for 4–6 independent experiments. *p<0.05 versus untreated cells.

References

    1. DeBerardinis RJ, Lum JJ, Hatzivassiliou G, Thompson CB (2008) The biology of cancer: metabolic reprogramming fuels cell growth and proliferation. Cell Metab 7: 11–20. - PubMed
    1. Warburg O (1956) On the origin of cancer cells. Science 123: 309–314. - PubMed
    1. Warburg O (1956) On respiratory impairment in cancer cells. Science 124: 269–270. - PubMed
    1. Ortega AD, Sanchez-Arago M, Giner-Sanchez D, Sanchez-Cenizo L, Willers I, et al. (2009) Glucose avidity of carcinomas. Cancer Lett 276: 125–135. - PubMed
    1. Menendez JA, Lupu R (2007) Fatty acid synthase and the lipogenic phenotype in cancer pathogenesis. Nat Rev Cancer 7: 763–777. - PubMed

Publication types

MeSH terms