

Spatial and temporal patterns of dengue transmission along a Red Sea coastline: a longitudinal entomological and serological survey in Port Sudan city
- PMID: 23029582
- PMCID: PMC3459851
- DOI: 10.1371/journal.pntd.0001821
Spatial and temporal patterns of dengue transmission along a Red Sea coastline: a longitudinal entomological and serological survey in Port Sudan city
Abstract
Background: Dengue is an emerging health problem in several coastlines along the Red Sea. The objective of the present work is to elucidate spatial and temporal patterns of dengue transmission in Port Sudan.
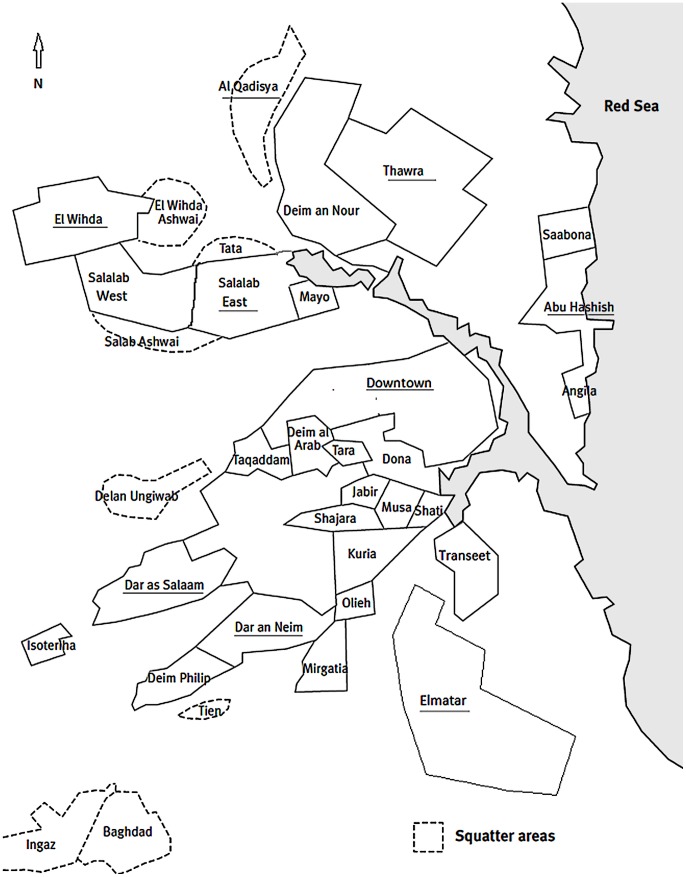
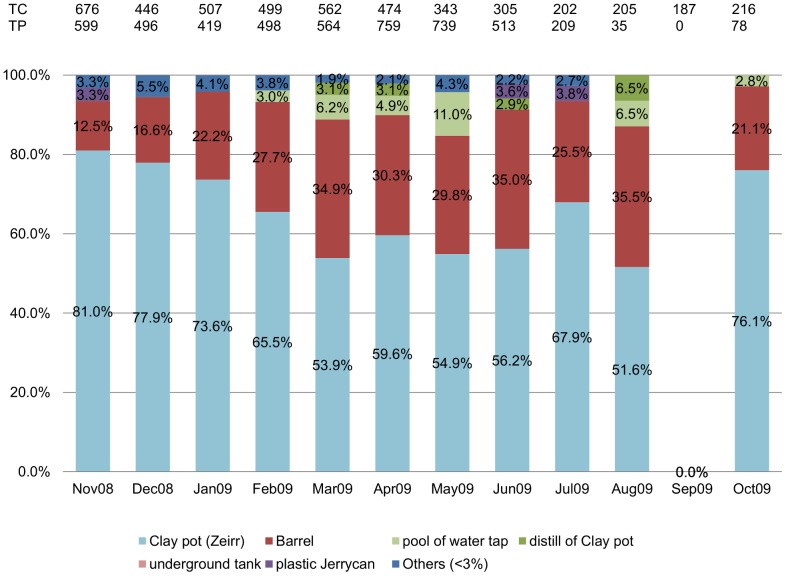
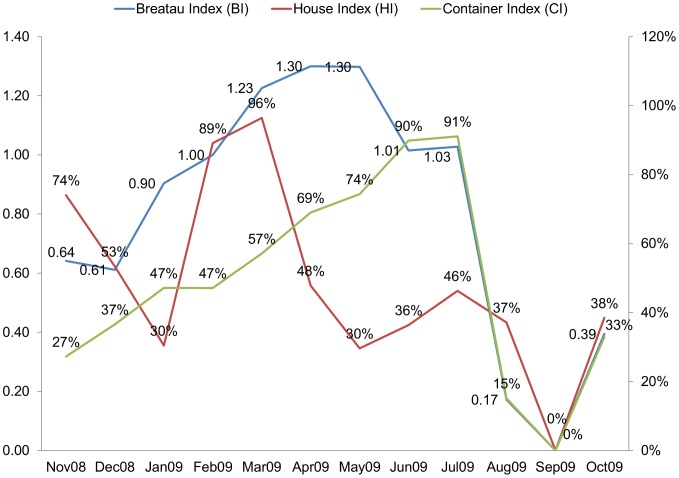
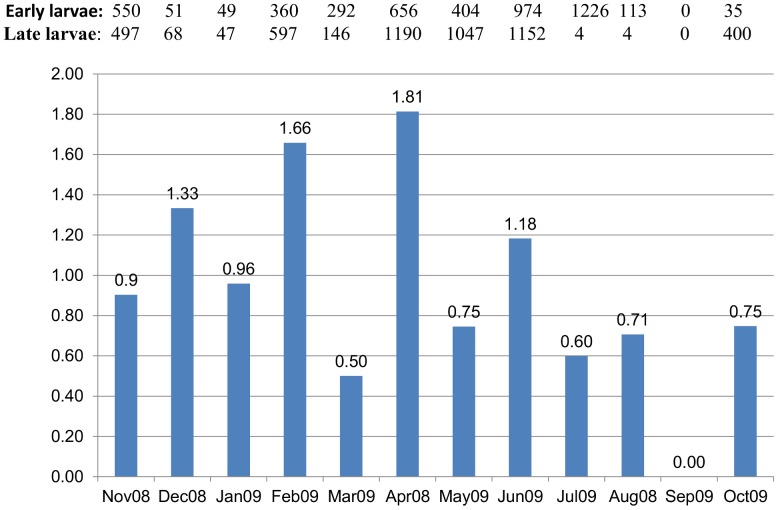
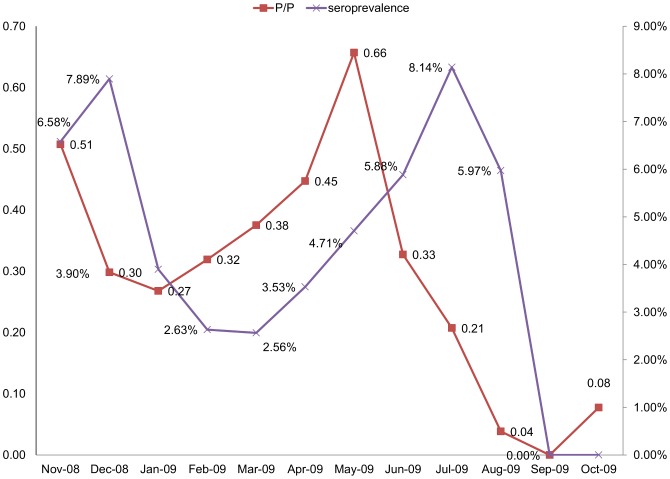
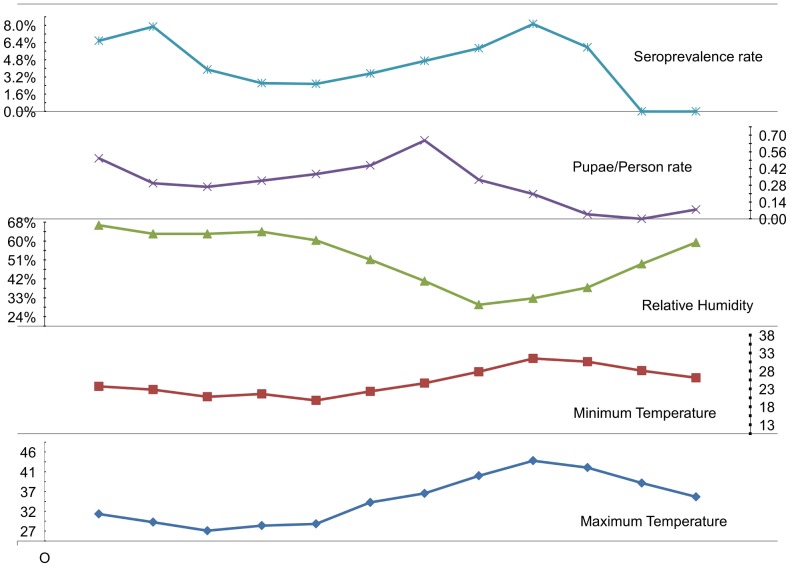
Methods/findings: A longitudinal study with three cross-sectional surveys was carried out in upper, middle and lower class neighborhoods, from November 2008 to October 2009. Monthly, entomological surveys were followed by serological surveys in dengue vector-positive houses. Meteorological records were obtained from two weather stations in the city during the same time. Overall, 2825 houses were inspected. Aedes aegypti represented 65% (35,714/54,944) and 68% (2526/3715) of the collected larvae and pupae, respectively. Out of 4640 drinking water containers, 2297 were positive for Ae. aegypti. Clay-pots "Zeirr" followed by plastic barrels were key productive containers for pupae of dengue vector, 63% (n = 3959) and 26% (n = 1651), respectively. A total of 791 blood samples were tested using PanBio Capture/Indirect IgM ELISA. Overall, the sero-prevalence rate of dengue ranged between 3%-8% (41/791), compared to an incidence of 29-40 new cases per 10,000 (193/54886) in the same examined population. Lower and middle class neighborhoods had higher entomological indices compared with upper class ones (p<0.001). Although, dengue incidence rate was significantly lower in the middle and lower class neighborhoods (F = 73.97, d.f. = 2, p<0.001), no difference in IgM prevalence was shown. The city is subject to two transmission peaks in the winter (i.e. November-January), and summer (i.e. June-August). The serological peaks of dengue are preceded by entomological peaks that occur before the onset of winter (November) and summer (March) respectively.
Conclusion: Dengue incidence is heterogeneously distributed across the neighborhoods of Port Sudan and exhibits a bi-cyclic intra-annual pattern. Hence, it should be feasible to carry out timely vector control measures to prevent or reduce dengue transmission.
Conflict of interest statement
The authors have declared that no competing interests exist.
Figures

References
-
- WHO (2009) Dengue: guidelines for diagnosis, treatment, prevention and control- New edition. WHO/HTM/NTD/DEN/2009.1 - PubMed
-
- Kyle JL, Harris E (2008) Global spread and persistence of dengue. Annu Rev Microbiol 62: 71–92. - PubMed
-
- Gould EA, Gallian P, De Lamballerie X, Charrel RN (2010) First cases of autochthonous dengue fever and chikungunya fever in France: from bad dream to reality!. Clin Microbiol Infect 16: 1702–4 doi: 10.1111/j.1469-0691. - PubMed
-
- Enserink M (2008) A Mosquito Goes Global. Science 320–866, 320, 5878, 864-866. - PubMed
Publication types
MeSH terms
Substances
LinkOut - more resources
Full Text Sources
Medical
