Comparative Study
. 2012 Dec;30(12):2365-72.
doi: 10.1097/HJH.0b013e3283598eed.

Divergent localization of angiotensinogen mRNA and protein in proximal tubule segments of normal rat kidney

Affiliations
Comparative Study

Divergent localization of angiotensinogen mRNA and protein in proximal tubule segments of normal rat kidney

Masumi Kamiyama et al. J Hypertens. 2012 Dec.

Abstract

Objectives: Angiotensinogen in the kidneys is formed primarily in the proximal tubule cells and is secreted into the tubular fluid. Structurally, proximal tubules can be divided into three segments. The first segment, segment 1 (S1) is mainly confined to the pars convoluta, the second segment, segment 2 (S2) comprises the end of pars convoluta, and the third segment, segment 3 (S3) includes the major part of the pars recta. There are some reports describing angiotensinogen localization in kidneys; however, it remains uncertain which proximal tubule segments express angiotensinogen. To determine the detailed localization of angiotensinogen in the three proximal tubule segments, we established multistaining methods using segment-specific protein markers.

Methods: Using kidneys from Wistar-Kyoto rats, we performed immunohistochemistry and double or triple staining by fluorescence in-situ hybridization and/or immunofluorescence.

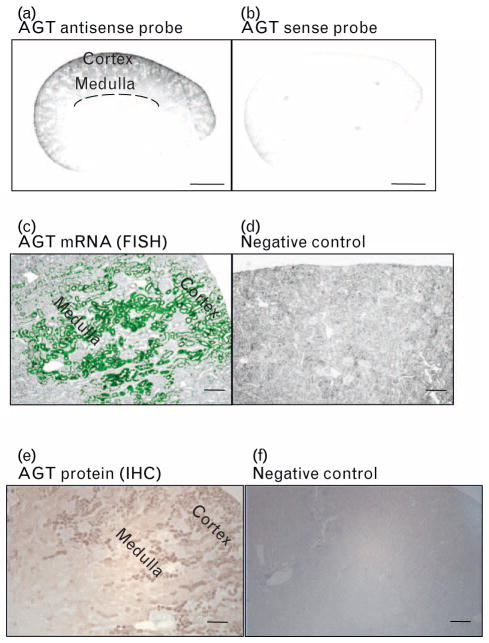
Results: Our results show that angiotensinogen mRNA and protein are expressed in the cortex and outer medulla of the normal rat kidney. Angiotensinogen mRNA was hardly detected in S1, detected weakly in S2 and strongly in S3 segments. In contrast, angiotensinogen protein was detected in S1 at high levels and less in S2 and S3 segments.

Conclusion: These data indicate divergence of angiotensinogen mRNA transcription and angiotensinogen protein synthesis and metabolism in different segments of the normal rat proximal tubules.


Conflict of interest statement

Conflicts of interest

There are no conflicts of interest.

Figures

FIGURE 1
FIGURE 1
High magnification of normal rat kidney showing the pattern of in-situ hybridization of angiotensinogen (AGT) antisense probe (a) and control (b). Scale bar, 2 mm. Representative images of AGT mRNA by FISH: (antisense probe: (c), sense probe: (d)) and AGT protein by immunohistochemistry (IHC); (IHC staining: (e), negative control staining: (f)) in normal rat kidney sections are detected over tubules in cortex and outer stripe of outer medulla. Magnification, × 100 (scale bar, 200 μm). FISH, fluorescence in-situ hybridization.
FIGURE 2
FIGURE 2
Immunofluorescence triple staining with antibodies against three proximal tubule segment-specific markers (a) and phase contrast (b). Green indicates S1-specific marker, sodium glucose cotransporter 2 (SGLT2) staining, red indicates S2-specific marker, carbonic anhydrase IV (CA IV) staining, and blue indicates S3-specific marker, ecto-ATPase staining. Magnification, × 200 (scale bar, 100 μm). CA IV, carbonic anhydrase IV; DT, distal tubules; ecto-ATPase, ecto-adenosine triphosphatase; G, glomerulus; S, segment; SGLT2, sodium glucose cotransporter 2.
FIGURE 3
FIGURE 3
Angiotensinogen AGT mRNA expression in the S1, S2, and S3 segments. AGT mRNA in the S1 segments (a–f). AGT mRNA in the S2 segments (g–l). AGT mRNA in the S3 segments (m–r). Green indicates AGT mRNA (a, d, g, j, m and p). Red indicates segment-specific markers, SGLT2 (b and e), CA IV (h and k), and ecto-ATPase (n and q). Merged images of AGT mRNA and each specific marker are shown in c, f, i, l, o and r. Arrows indicate merged areas. The images at the lower left show AGT mRNA and specific-markers are expressed strongly in the brush border. Dotted lines indicate the edge of the tissue. Magnification of a, b, c, g, h, i, m n and o, × 100 (scale bar, 200 μm). Magnification of d, e, f, j, k, l, p, q, and r, × 400 (scale bar, 50 μm). AGT, angiotensinogen; CA IV, carbonic anhydrase IV; CO; cortex; ecto-ATPase, ecto-adenosine triphosphatase; S, segment; SGLT2, sodium glucose cotransporter 2.
FIGURE 4
FIGURE 4
Angiotensinogen (AGT) mRNA expression in the S1 segments. The AGT mRNA staining in proximal tubules by FISH method (a) and SGLT2 staining proximal tubules by IHC method (b) in the same field of consecutive tissue sections was investigated. In consecutive section-2, positive staining for SGLT2 was numbered from 1 to 19. Same tubules in consecutive section-1 were also numbered. These two consecutive sections staining data reinforce that AGT mRNA expression is not detected much in S1 segments. The images at the lower left show AGT mRNA and SGLT2 are expressed strongly in the brush border. AGT, angiotensinogen; FISH, fluorescence in-situ hybridization; G, glomeruli; IHC, immunohistochemistry; S, segment; SGLT2, sodium glucose cotransporter 2. Magnification, × 200 (scale bar, 100 μm).
FIGURE 5
FIGURE 5
Angiotensinogen (AGT) protein expression in the S1, S2, and S3 segments. AGT protein in the S1 segments (a–f). AGT protein in the S2 segments (g–l). AGT protein in the S3 segments (m–r). Green indicates AGT protein (a, d, g, j, m and p). Red indicates segment-specific markers, SGLT2 (b and e), CA IV (h and k), and ecto-ATPase (n and q). Merged images of AGT protein and each specific-marker are shown in c, f, i, l, o and r. Arrows indicate merged areas. The images at the lower left show AGT protein and specific-markers are expressed strongly in the brush border. Dotted lines indicate the edge of the tissue. Magnification of a, b, c, g, h, i, m, n and o, × 100 (scale bar, 200 μm). Magnification of d, e, f, j, k, l, p, q, and r, × 400 (scale bar, 50 μm). AGT, angiotensinogen; CA IV, ecto-ATPase, ecto-adenosine triphosphatase, carbonic anhydrase IV; CO; cortex; S, segment; SGLT2, sodium glucose cotransporter 2.

References

    1. Kobori H, Nangaku M, Navar LG, Nishiyama A. The intrarenal renin-angiotensin system: from physiology to the pathobiology of hypertension and kidney disease. Pharmacol Rev. 2007;59:251–287. - PubMed
    1. Dzau VJ, Re R. Tissue angiotensin system in cardiovascular medicine: a paradigm shift? Circulation. 1994;89:493–498. - PubMed
    1. Danser AH, Admiraal PJ, Derkx FH, Schalekamp MA. Angiotensin I-to-II conversion in the human renal vascular bed. J Hypertens. 1998;16 (12 Pt 2):2051–2056. - PubMed
    1. Navar LG, Harrison-Bernard LM, Nishiyama A, Kobori H. Regulation of intrarenal angiotensin II in hypertension. Hypertension. 2002;39 (2 Pt 2):316–322. - PMC - PubMed
    1. Baum M, Quigley R, Quan A. Effect of luminal angiotensin II on rabbit proximal convoluted tubule bicarbonate absorption. Am J Physiol. 1997;273 (4 Pt 2):F595–F600. - PubMed

Publication types