. 2013 Jan;33(1):97-105.
doi: 10.1038/jcbfm.2012.137. Epub 2012 Oct 3.

Neurovascular coupling varies with level of global cerebral ischemia in a rat model

Affiliations

Neurovascular coupling varies with level of global cerebral ischemia in a rat model

Wesley B Baker et al. J Cereb Blood Flow Metab. 2013 Jan.

Abstract

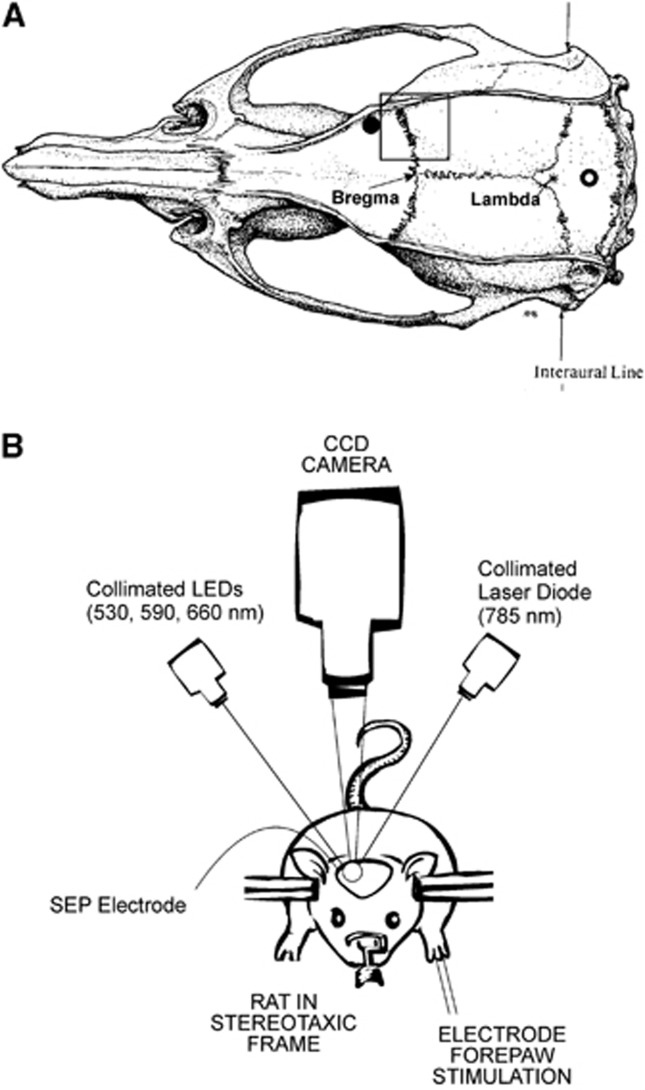
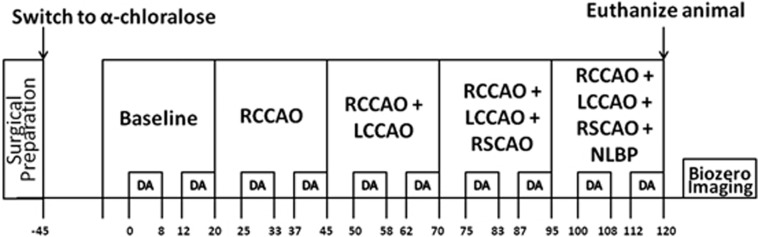
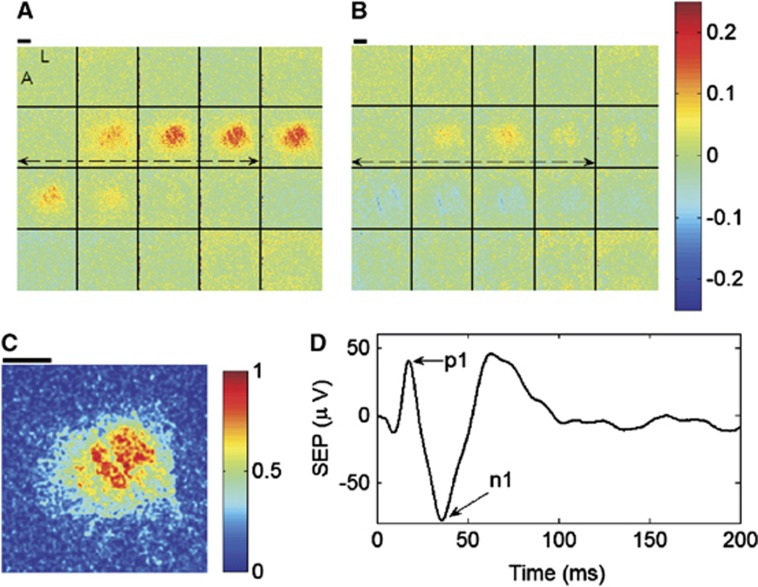
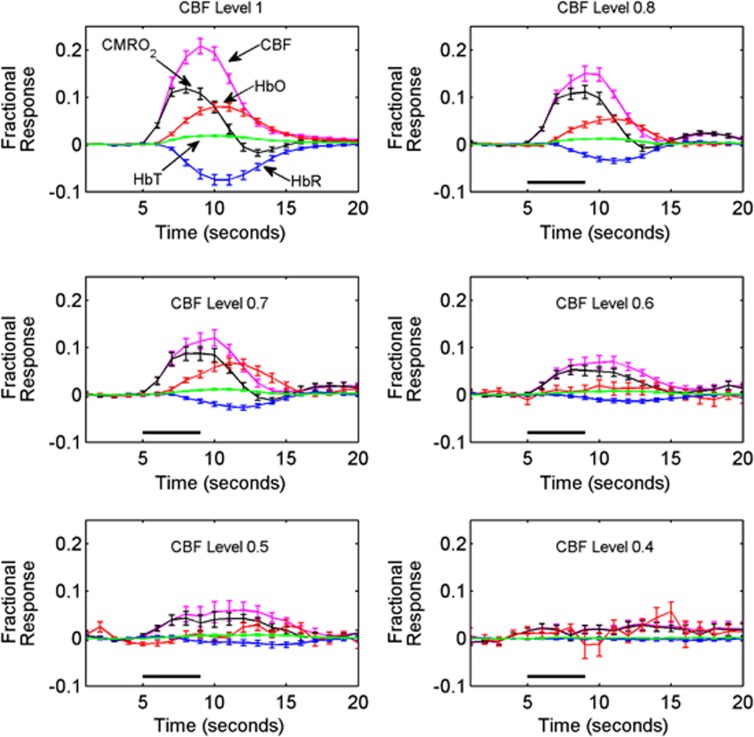
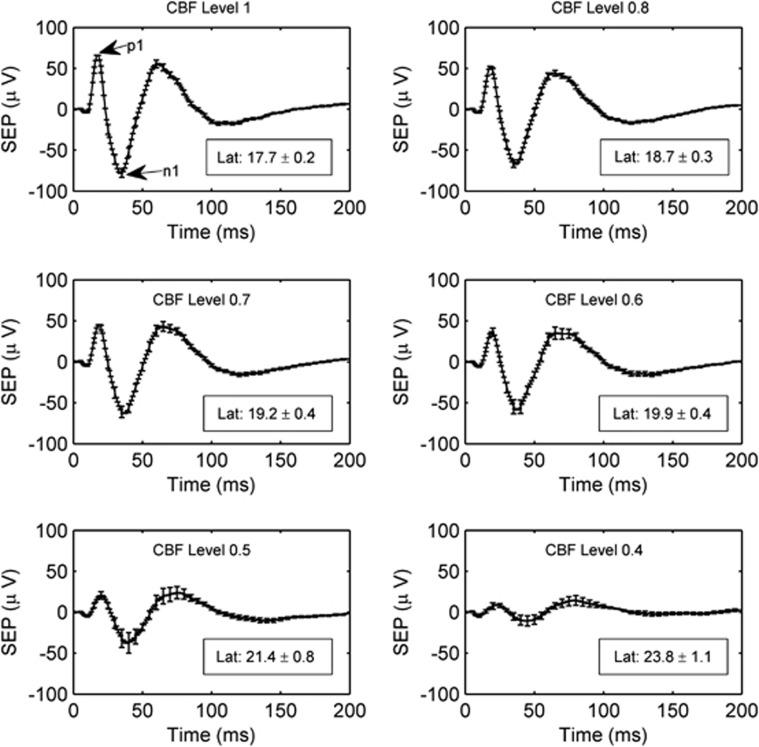
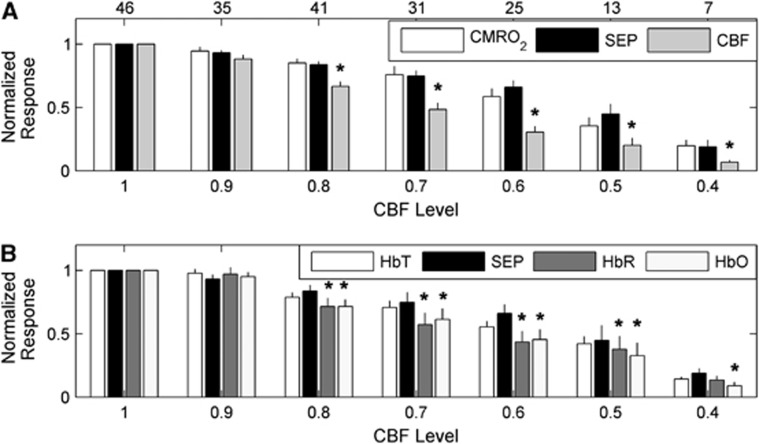
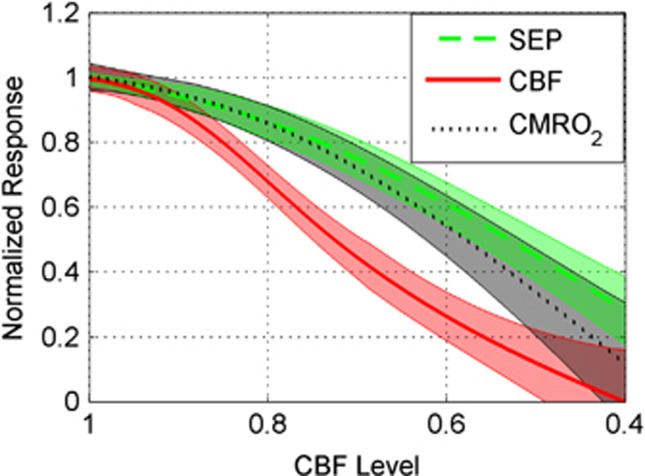
In this study, cerebral blood flow, oxygenation, metabolic, and electrical functional responses to forepaw stimulation were monitored in rats at different levels of global cerebral ischemia from mild to severe. Laser speckle contrast imaging and optical imaging of intrinsic signals were used to measure changes in blood flow and oxygenation, respectively, along with a compartmental model to calculate changes in oxygen metabolism from these measured changes. To characterize the electrical response to functional stimulation, we measured somatosensory evoked potentials (SEPs). Global graded ischemia was induced through unilateral carotid artery occlusion, bilateral carotid artery occlusion, bilateral carotid and right subclavian artery (SCA) occlusion, or carotid and SCA occlusion with negative lower body pressure. We found that the amplitude of the functional metabolic response remained tightly coupled to the amplitude of the SEP at all levels of ischemia observed. However, as the level of ischemia became more severe, the flow response was more strongly attenuated than the electrical response, suggesting that global ischemia was associated with an uncoupling between the functional flow and electrical responses.


Figures

Figure 1
Figure 1
(A) Diagram of the rat brain showing the 5 × 5 mm thinned part of the skull over the forepaw area of the cerebral cortex for hemodynamic imaging (black square) and the burr hole locations for electrodes to measure somatosensory evoked potentials (SEPs) (filled and open circles). (B) Schematic of instrument used for optical imaging of hemodynamics.
Figure 2
Figure 2
Schematic showing the timeline of the study in minutes (time axis not to scale). DA stands for data acquisition, where we collected laser speckle and spectral images and applied forepaw stimulation trains (1.5 mA, 0.3 ms rectangular pulses delivered at 3 Hz for 4 seconds) every 30 seconds as described in the text. The top row of boxes indicates the cerebral blood flow (CBF) conditions, which are baseline (i.e., preischemic), right common carotid artery occlusion (RCCAO), right and left common carotid artery occlusion (RCCAO+LCCAO), right and left common carotid artery occlusion with right subclavian artery occlusion (RCCAO+LCCAO+RSCAO), and the occlusion of the previous three arteries with the application of negative lower body pressure (NLBP).
Figure 3
Figure 3
Image montages of fractional changes in cerebral blood flow (CBF) (A) and cerebral metabolic consumption of oxygen (CMRO2) (B) averaged across stimulation trials during the baseline, or preischemic, CBF condition for an exemplar animal. The fractional changes are relative to the mean of the parameters over the 5-second prestimulus time windows. Each image in the montages is spaced one second apart when read from left to right and top to bottom. The dashed double arrows indicate the 4-second forepaw stimulus, and the letters L and A within the first image of the CBF montage stand for lateral and anterior, respectively, to indicate image orientation. For region of interest (ROI) selection, a temporal correlation coefficient was computed at every pixel between CBF and the forepaw stimulus during preischemic stimulation, and the resulting correlation coefficient image was then normalized to the maximum pixel. The ROI for the animal in this figure consists of all pixels in the animal's normalized correlation coefficient image (C) with values >0.8 (see text). The thick black lines in (A) through (C) are 1 mm scale bars. (D) The somatosensory evoked potential (SEP) signal averaged across stimulation trials during the preischemic baseline condition of the same animal. The difference between the p1 and n1 peaks in the SEP signal was used to characterize the electrical response to stimulation.
Figure 4
Figure 4
The average fractional responses of cerebral blood flow (CBF), cerebral metabolic consumption of oxygen (CMRO2), cerebral oxy-hemoglobin (HbO), cerebral deoxy-hemoglobin (HbR), and cerebral total hemoglobin (HbT) measured at various CBF levels (see Equation 3) within the specified bins. The CBF bins are labeled by their central numbers (e.g., CBF Level 0.8 spans the range of CBF levels from 0.75 to 0.85), and the CBF Level 1 indicates the preischemic responses. Here, the CBF bin 0.9 is omitted since the temporal plots look very similar to the preischemic responses. The error bars indicate the standard errors of these averages, and the 4-second forepaw stimulus is indicated in the panels by a thick black line (omitted from CBF Level 1 panel for readability).
Figure 5
Figure 5
The average somatosensory evoked potential (SEP) across animals at each cerebral blood flow (CBF) level bin. As in Figure 4, the CBF level bins are specified by their central numbers. The error bars indicate the standard errors of these averages, and the time zero here corresponds to the arrival of a stimulation pulse. The boxes in each panel contain the SEP latencies (mean±standard error) in milliseconds at each CBF level. The latency is the time from stimulus to the p1 peak. SEP latencies are significantly associated with CBF level (P<0.0001).
Figure 6
Figure 6
Average normalized peak hemodynamic and somatosensory evoked potential (SEP) responses (Equations 2a and 2b) across animals at the binned cerebral blood flow (CBF) levels of ischemia (Equation 3) specified on the horizontal axis. As in Figures 4 and 5, the levels of ischemia are discretized into bins with widths of 10 percentage points, such that a CBF level of 0.9 corresponds to the range of CBF levels between 0.85 and 0.95, a CBF level of 0.8 corresponds to the range of CBF levels between 0.75 and 0.85, etc. (A) From left to right, the average normalized cerebral metabolic consumption of oxygen (CMRO2), SEP, and CBF responses. (B) From left to right, the average normalized cerebral total hemoglobin (HbT), SEP, cerebral oxy-hemoglobin (HbO), and cerebral deoxy-hemoglobin (HbR) responses. The top row of numbers in (A) indicates the number of animals contributing to the averages for each CBF level. In both panels, the thin black lines are standard errors to the averages, and the asterisks (*) denote statistically significant differences (P<0.05) with SEP at a given bin, as determined from a mixed effects model of the mean logarithm of the ratio of SEP with the respective hemodynamic parameter (see Statistical analysis). Recall that by definition, the preischemic response at CBF Level 1 is 1, which is why there are no error bars in the first bins of both panels.
Figure 7
Figure 7
Mean normalized response (Equations 2a and 2b) across animals (thick lines) of somatosensory evoked potential (SEP), cerebral blood flow (CBF), and cerebral metabolic consumption of oxygen (CMRO2) as a function of CBF level (Equation 3). Mean values shown are based on individual mixed effects models (see Statistical analysis) along with their 95% confidence intervals (shaded regions). CBF differed from SEP (P<0.0001) and CMRO2 (P<0.0001), but SEP and CMRO2 were not significantly different (P>0.1).

References

    1. Vanzetta I, Grinvald A. Coupling between neuronal activity and microcirculation: implications for functional brain imaging. HFSP J. 2008;2:79–98. - PMC - PubMed
    1. Iadecola C. Neurovascular regulation in the normal brain and in Alzheimer's disease. Nat Rev Neurosci. 2004;5:347–360. - PubMed
    1. del Zoppo GJ. The neurovascular unit in the setting of stroke. J Intern Med. 2010;267:156–171. - PMC - PubMed
    1. Boas DA, Dunn AK. Laser speckle contrast imaging in biomedical optics. J Biomed Opt. 2010;15:011109. - PMC - PubMed
    1. Dunn AK, Bolay T, Moskowitz MA, Boas DA. Dynamic imaging of cerebral blood flow using laser speckle. J Cereb Blood Flow Metab. 2001;21:195–201. - PubMed

Publication types

LinkOut - more resources