

Genetic association of cyclic AMP signaling genes with bipolar disorder
- PMID: 23032945
- PMCID: PMC3565822
- DOI: 10.1038/tp.2012.92
Genetic association of cyclic AMP signaling genes with bipolar disorder
Abstract
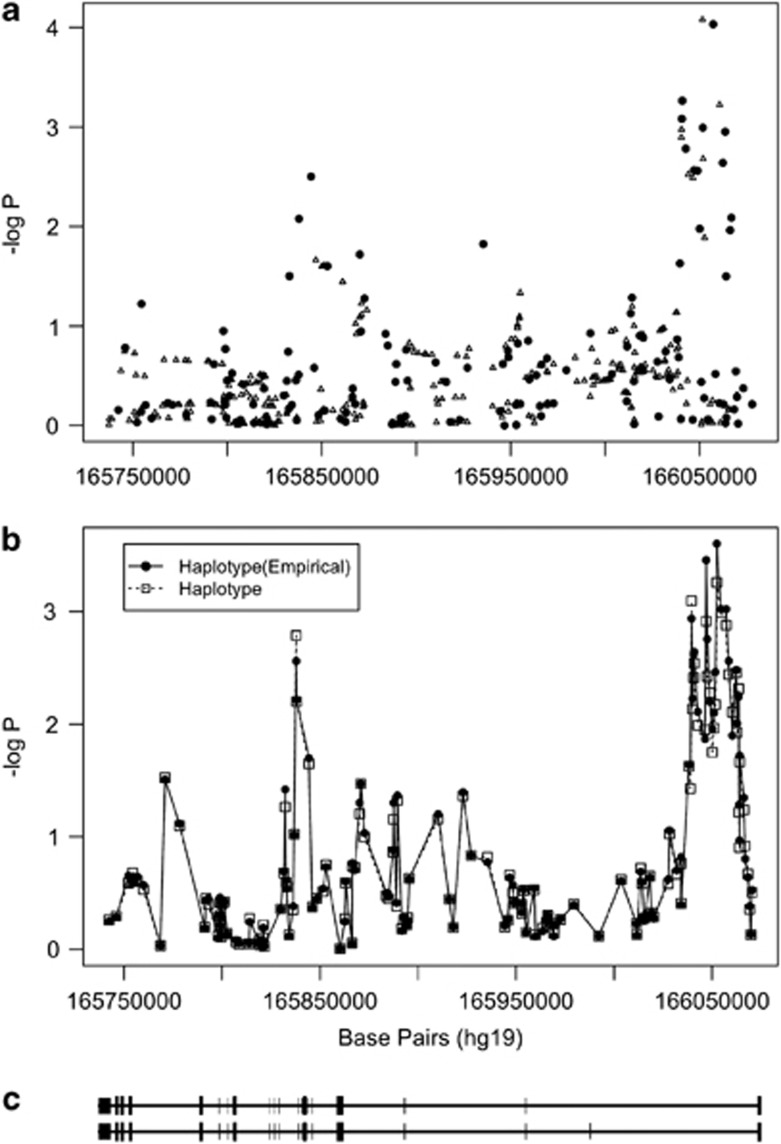
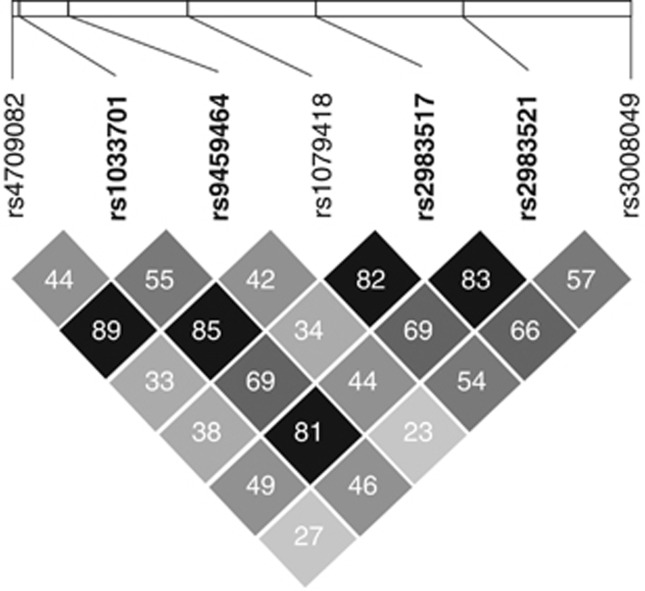
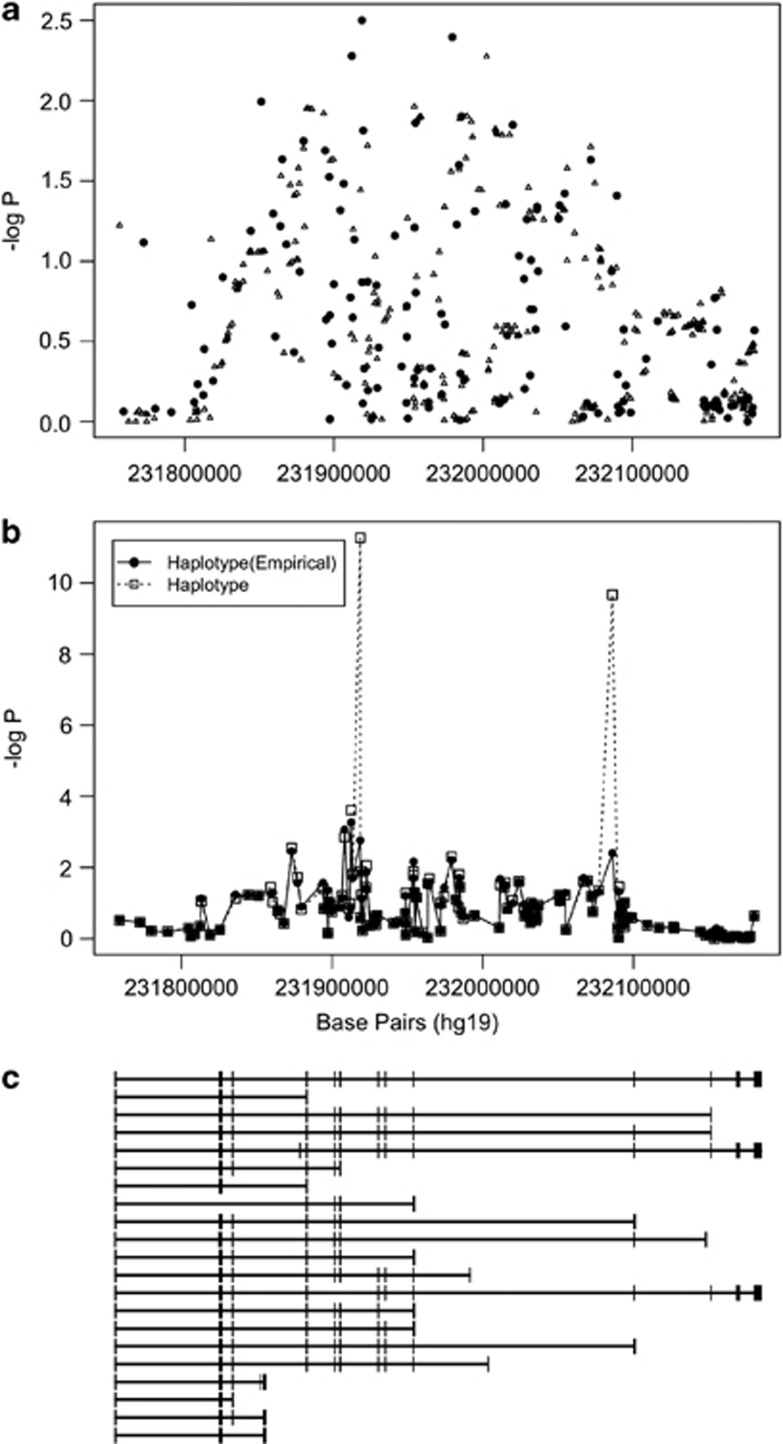
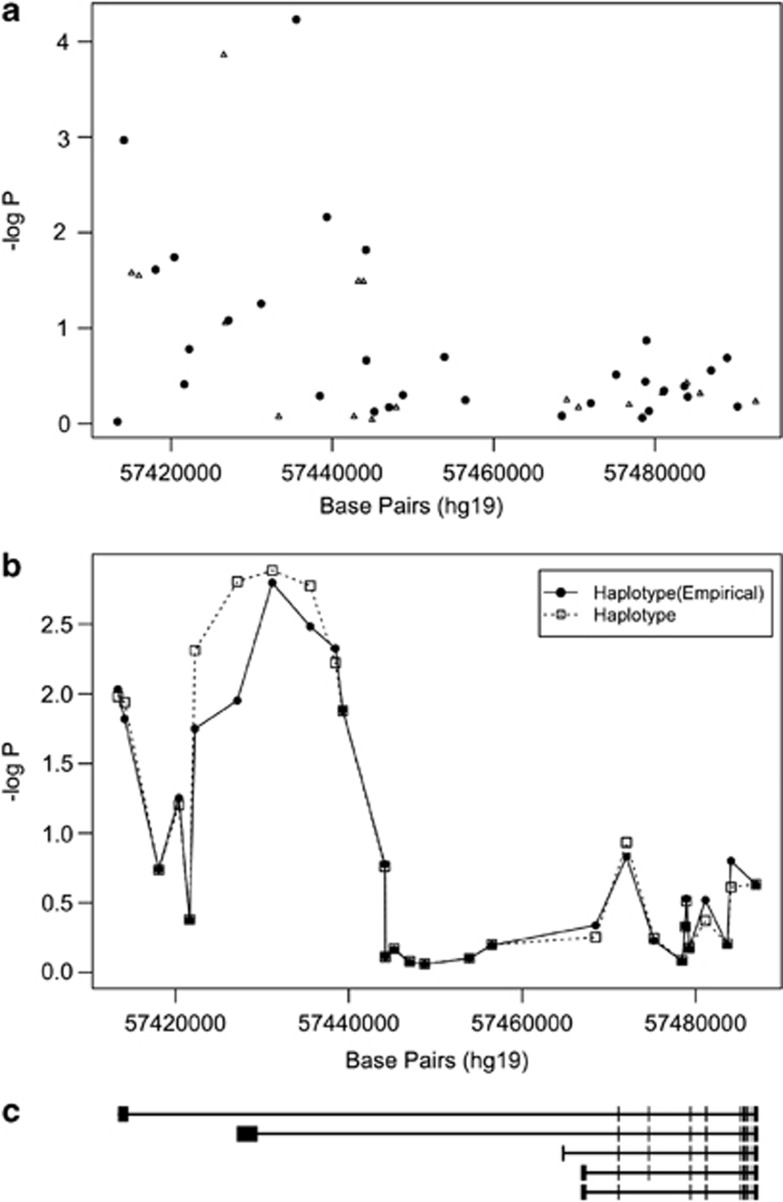
The genetic basis for bipolar disorder (BPD) is complex with the involvement of multiple genes. As it is well established that cyclic adenosine monophosphate (cAMP) signaling regulates behavior, we tested variants in 29 genes that encode components of this signaling pathway for associations with BPD type I (BPD I) and BPD type II (BPD II). A total of 1172 individuals with BPD I, 516 individuals with BPD II and 1728 controls were analyzed. Single SNP (single-nucleotide polymorphism), haplotype and SNP × SNP interactions were examined for association with BPD. Several statistically significant single-SNP associations were observed between BPD I and variants in the PDE10A gene and between BPD II and variants in the DISC1 and GNAS genes. Haplotype analysis supported the conclusion that variation in these genes is associated with BPD. We followed-up PDE10A's association with BPD I by sequencing a 23-kb region in 30 subjects homozygous for seven minor allele risk SNPs and discovered eight additional rare variants (minor allele frequency < 1%). These single-nucleotide variants were genotyped in 999 BPD cases and 801 controls. We obtained a significant association for these variants in the combined sample using multiple methods for rare variant analysis. After using newly developed methods to account for potential bias from sequencing BPD cases only, the results remained significant. In addition, SNP × SNP interaction studies suggested that variants in several cAMP signaling pathway genes interact to increase the risk of BPD. This report is among the first to use multiple rare variant analysis methods following common tagSNPs associations with BPD.
Figures
Similar articles
-
Association between polymorphisms in the vesicle-associated membrane protein-associated protein A (VAPA) gene on chromosome 18p and bipolar disorder.J Neural Transm (Vienna). 2008 Sep;115(9):1339-45. doi: 10.1007/s00702-008-0093-9. Epub 2008 Jul 30. J Neural Transm (Vienna). 2008. PMID: 18665321
-
Association of functional polymorphisms of the human tryptophan hydroxylase 2 gene with risk for bipolar disorder in Han Chinese.Arch Gen Psychiatry. 2007 Sep;64(9):1015-24. doi: 10.1001/archpsyc.64.9.1015. Arch Gen Psychiatry. 2007. PMID: 17768266
-
Association between polymorphisms in the metallophosphoesterase (MPPE1) gene and bipolar disorder.Am J Med Genet B Neuropsychiatr Genet. 2010 Apr 5;153B(3):830-6. doi: 10.1002/ajmg.b.31042. Am J Med Genet B Neuropsychiatr Genet. 2010. PMID: 19859903 Free PMC article.
-
Tag SNP selection for association studies.Genet Epidemiol. 2004 Dec;27(4):365-74. doi: 10.1002/gepi.20028. Genet Epidemiol. 2004. PMID: 15372618 Review.
-
Meta-analysis of MTHFR gene variants in schizophrenia, bipolar disorder and unipolar depressive disorder: evidence for a common genetic vulnerability?Brain Behav Immun. 2011 Nov;25(8):1530-43. doi: 10.1016/j.bbi.2010.12.006. Epub 2010 Dec 24. Brain Behav Immun. 2011. PMID: 21185933 Review.
Cited by
-
Mitochondrial dysfunction and autism: comprehensive genetic analyses of children with autism and mtDNA deletion.Behav Brain Funct. 2018 Feb 20;14(1):4. doi: 10.1186/s12993-018-0135-x. Behav Brain Funct. 2018. PMID: 29458409 Free PMC article.
-
Prenatal immune activation alters the adult neural epigenome but can be partly stabilised by a n-3 polyunsaturated fatty acid diet.Transl Psychiatry. 2018 Jul 2;8(1):125. doi: 10.1038/s41398-018-0167-x. Transl Psychiatry. 2018. PMID: 29967385 Free PMC article.
-
Second messenger/signal transduction pathways in major mood disorders: moving from membrane to mechanism of action, part II: bipolar disorder.CNS Spectr. 2013 Oct;18(5):242-51. doi: 10.1017/S1092852913000138. Epub 2013 Mar 11. CNS Spectr. 2013. PMID: 23472710 Free PMC article. Review.
-
TAK-063, a novel PDE10A inhibitor with balanced activation of direct and indirect pathways, provides a unique opportunity for the treatment of schizophrenia.CNS Neurosci Ther. 2018 Jul;24(7):604-614. doi: 10.1111/cns.12798. Epub 2018 Jan 9. CNS Neurosci Ther. 2018. PMID: 29318783 Free PMC article. Review.
-
Comorbid psoriasis-bipolar disorder successfully treated with apremilast: much more than a mere coincidence?Gen Psychiatr. 2020 May 17;33(3):e100181. doi: 10.1136/gpsych-2019-100181. eCollection 2020. Gen Psychiatr. 2020. PMID: 32524074 Free PMC article.
References
-
- Judd LL, Akiskal HS, Schettler PJ, Coryell W, Maser J, Rice JA, et al. The comparative clinical phenotype and long term longitudinal episode course of bipolar I and II: a clinical spectrum or distinct disorders. J Affect Disord. 2003;73:19–32. - PubMed
-
- MacQueen GM, Young LT, Joffe RT. A review of psychosocial outcome in patients with bipolar disorder. Acta Psychiatr Scand. 2001;103:163–170. - PubMed
Publication types
MeSH terms
Substances
Grants and funding
LinkOut - more resources
Full Text Sources
Medical
Research Materials
