. 2013 Jan;21(1):149-57.
doi: 10.1038/mt.2012.185. Epub 2012 Oct 2.

The possible "proton sponge " effect of polyethylenimine (PEI) does not include change in lysosomal pH

Affiliations

The possible "proton sponge " effect of polyethylenimine (PEI) does not include change in lysosomal pH

Rikke V Benjaminsen et al. Mol Ther. 2013 Jan.

Abstract

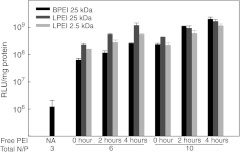
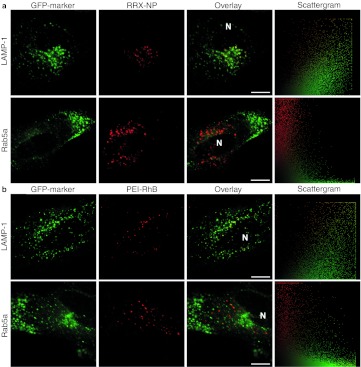
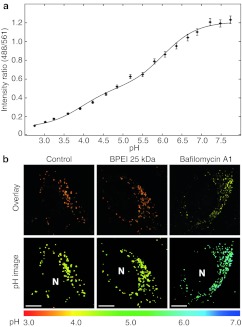
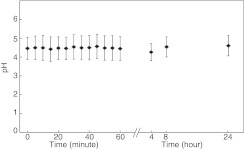
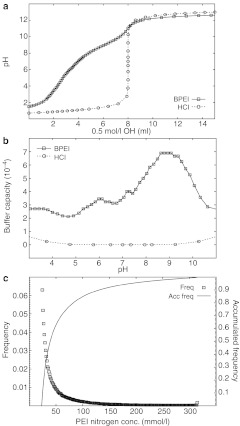
Polycations such as polyethylenimine (PEI) are used in many novel nonviral vector designs and there are continuous efforts to increase our mechanistic understanding of their interactions with cells. Even so, the mechanism of polyplex escape from the endosomal/lysosomal pathway after internalization is still elusive. The "proton sponge " hypothesis remains the most generally accepted mechanism, although it is heavily debated. This hypothesis is associated with the large buffering capacity of PEI and other polycations, which has been interpreted to cause an increase in lysosomal pH even though no conclusive proof has been provided. In the present study, we have used a nanoparticle pH sensor that was developed for pH measurements in the endosomal/lysosomal pathway. We have carried out quantitative measurements of lysosomal pH as a function of PEI content and correlate the results to the "proton sponge " hypothesis. Our measurements show that PEI does not induce change in lysosomal pH as previously suggested and quantification of PEI concentrations in lysosomes makes it uncertain that the "proton sponge " effect is the dominant mechanism of polyplex escape.


Figures

Figure 1
Figure 1
In vitro transfection efficiency of polyplexes with free polyethylenimine (PEI) chains. HeLa cells were transfected with branched PEI (BPEI) 25 kDa polyplexes of N/P = 3 in the presence of different free PEI chains (BPEI 25 kDa, LPEI 25, and 2.5 kDa). Free PEI chains of N/P = 3 and 7 (corresponding to polyplexes of N/P = 6 and 10, respectively) were added simultaneously (0), 2, and 4 hours after administration of polyplexes. RLU, relative light units; LPEI, linear PEI. Results presented as mean of triplicate ± SD. Representative of two independent experiments.
Figure 2
Figure 2
Colocalization of nanoparticle and polyethylenimine (PEI) with lysosomes. Colocalization of (a) RRX-NP and (b) PEI-RhB with lysosomal marker GFP-LAMP-1 and early endosomal marker GFP-Rab5a. HeLa cells were transduced with plasmids encoding green fluorescent protein (GFP)-tagged marker and incubated with RRX-NP for 24 hours or PEI-RhB for 4 hours. Scattergram: all pixels in the corresponding overlay image presented as red intensity in relation to green intensity. Bar = 10 µm. Representative of three independent experiments. LAMP-1, lysosome-associated membrane protein-1; RRX, rhodamine red X; RhB, rhodamine B; NP, nanoparticle; N, nucleus.
Figure 3
Figure 3
Calibration curve of pH nanosensor and pH measurements in cells. (a) In vitro calibration of triple-labeled pH nanosensor performed in buffer. Ratiometric measurements of the nanosensor are related to pH of the buffer and fitted to Equation (1). Mean ± SD are presented. (b) Nanosensor internalized during 24 hours by HeLa cells imaged by confocal microscopy without further treatment or treated with free branched PEI (BPEI) 25 kDa or bafilomycin A1. The ratio of the pH-sensitive and reference fluorophores was converted into pH via the calibration curve and color coded on a common linear scale according to pH. Top panel: Overlay images of the green pH sensitive signal with the red insensitive signal. Bottom panel: pH images, N, nucleus. Bar = 10 µm. Representative of four independent experiments.
Figure 4
Figure 4
Lysosomal pH in response to polyethylenimine (PEI). (a) HeLa cells with internalized nanosensor for 24 hours were treated with PEI-A633 for 4 hours and imaged by confocal microscopy. Top row: The green pH-sensitive signal and the red reference signal from the nanosensor can be distinguished from the dark red signal of PEI-A633 (here presented as cyan for improved visualization and colocalization). Bright field (BF) image of cells. Bottom row: Overlay image of green and red signal. The ratio of green to red was converted to pH via the calibration curve and color coded on a linear scale according to pH. Overlay red/cyan shows colocalization (white signal) of the nanosensor with PEI-A633 with the corresponding scattergram. Bar = 10 µm. (b) Histogram showing pH distribution of nanosensor containing cells without further treatment (control) or treated with PEI-A633 or bafilomycin A1. Mean ± SEM (n = 9, 13, and 8 images for control, BPEI-A633 and Bafilomycin A1, respectively) are presented. (c) pH of PEI-A633 treated cells plotted as a function of the intensity of PEI-A633 in single lysosomes. The pH measurements of the pH color coded images are presented in relation to the corresponding pixel intensities of PEI-A633. Representative of three independent experiments. BPEI, branched PEI; NP, nanoparticle; A633, Alexa Fluor 633; N, nucleus.
Figure 5
Figure 5
Measurements of lysosomal pH in response to polyethylenimine (PEI) over time. HeLa cells with internalized nanosensor for 24 hours were exposed to branched PEI (BPEI) 25 kDa and images were collected about one every minute of different cells for 1 hour. After 4 hours, the PEI was washed off and five images were collected for each time point 4, 8, and 24 hours after addition of PEI. Time point zero was collected just before addition of PEI. Four to five images for each 5 minutes interval were grouped for the analysis of each time point. Presented is mean ± SD of the pH frequency distribution obtained from the image analysis. Representative of three independent experiments.
Figure 6
Figure 6
Titration of polyethylenimine (PEI) and lysosomal content of PEI. (a) Titration of an acidified solution of branched PEI (BPEI) 25 kDa with an initial concentration of 232 mmol/l PEI nitrogen atoms and 200 mmol/l HCl. For comparison 200 mmol/l HCl was titrated accordingly. Representative of three independent experiments. (b) The buffer capacity of BPEI 25 kDa was calculated from a, and presented as a function of pH. The buffer capacity of aqueous HCl is presented for comparison. (c) HeLa cells were treated with BPEI-RhB at N/P = 7 for 4 hours and images were collected. Intensity values were then converted to a concentration of PEI nitrogen atoms according to a calibration curve. Presented are the frequency distribution and the corresponding accumulated frequency distribution. Representative of two independent experiments.

References

    1. Boussif O, Lezoualc'h F, Zanta MA, Mergny MD, Scherman D, Demeneix B.et al. (1995A versatile vector for gene and oligonucleotide transfer into cells in culture and in vivo: polyethylenimine Proc Natl Acad Sci USA 927297–7301. - PMC - PubMed
    1. Mintzer MA., and, Simanek EE. Nonviral vectors for gene delivery. Chem Rev. 2009;109:259–302. - PubMed
    1. Zhang Y, Satterlee A., and, Huang L. In vivo gene delivery by nonviral vectors: overcoming hurdles. Mol Ther. 2012;20:1298–1304. - PMC - PubMed
    1. Sawant RR, Sriraman SK, Navarro G, Biswas S, Dalvi RA., and, Torchilin VP. Polyethyleneimine-lipid conjugate-based pH-sensitive micellar carrier for gene delivery. Biomaterials. 2012;33:3942–3951. - PMC - PubMed
    1. Brito L, Little S, Langer R., and, Amiji M. Poly(beta-amino ester) and cationic phospholipid-based lipopolyplexes for gene delivery and transfection in human aortic endothelial and smooth muscle cells. Biomacromolecules. 2008;9:1179–1187. - PubMed

Publication types