. 2012 Oct;24(10):4173-86.
doi: 10.1105/tpc.112.102517. Epub 2012 Oct 2.

Structural basis of efficient electron transport between photosynthetic membrane proteins and plastocyanin in spinach revealed using nuclear magnetic resonance

Affiliations

Structural basis of efficient electron transport between photosynthetic membrane proteins and plastocyanin in spinach revealed using nuclear magnetic resonance

Takumi Ueda et al. Plant Cell. 2012 Oct.

Abstract

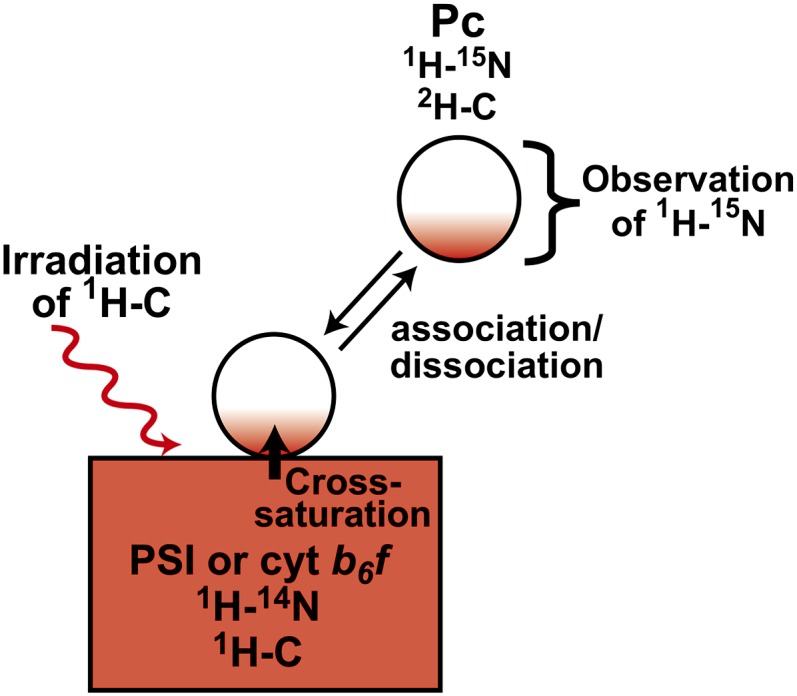
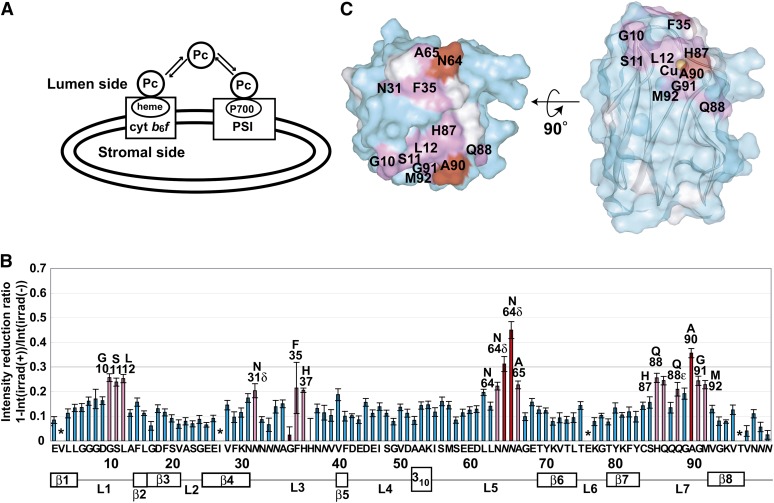
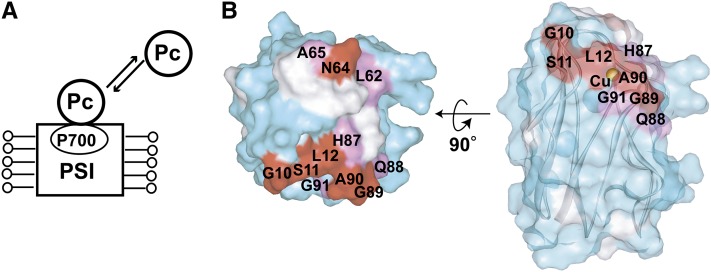
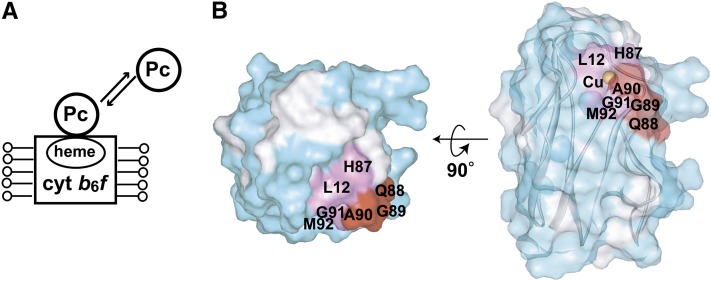
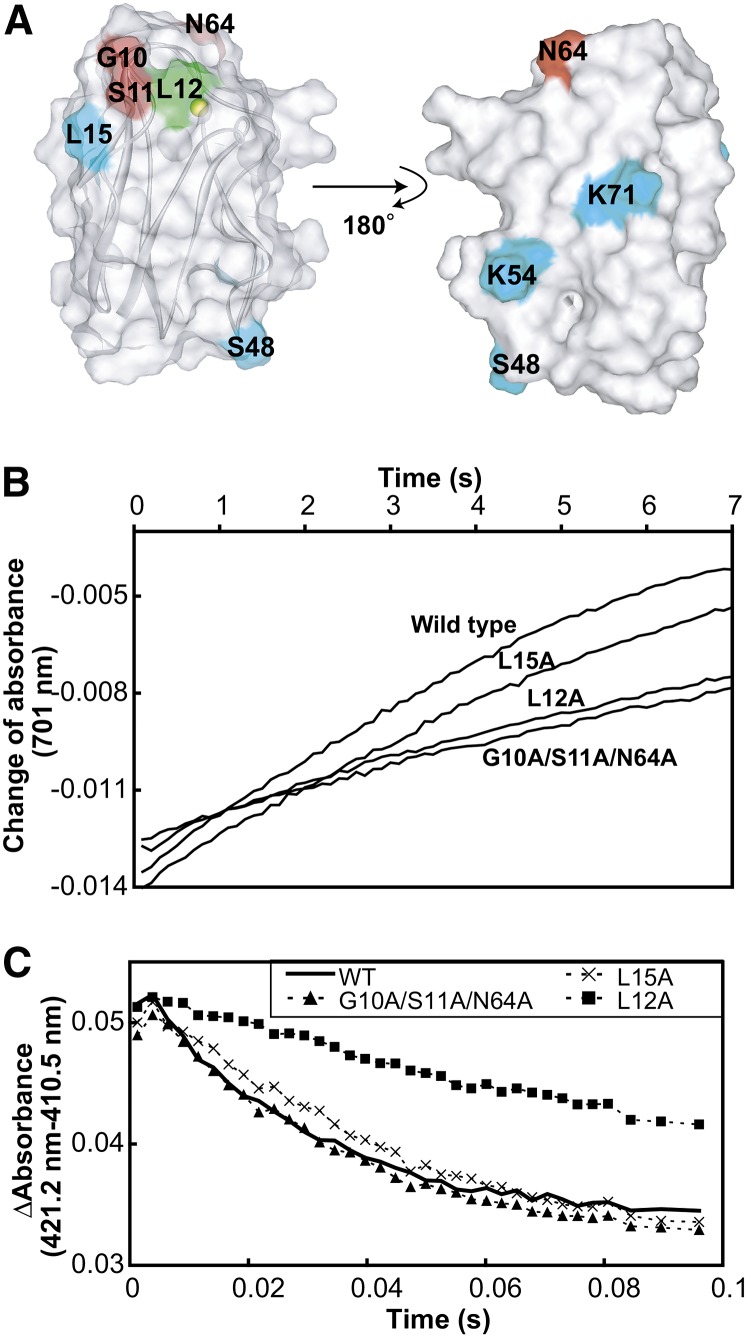
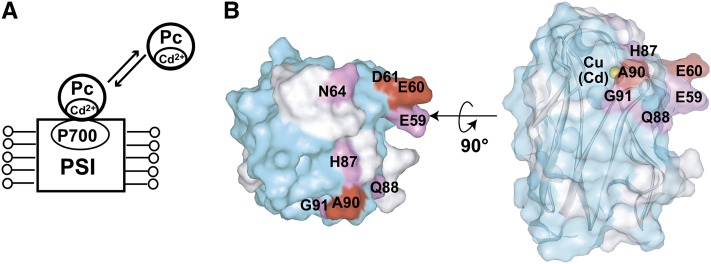
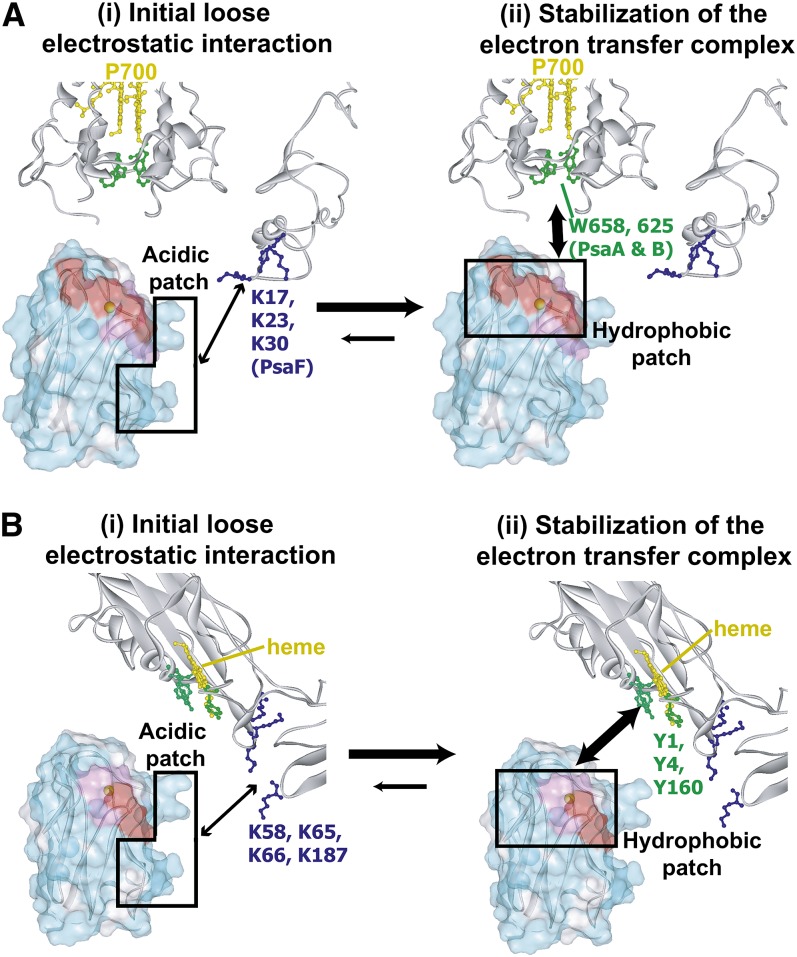
In the photosynthetic light reactions of plants and cyanobacteria, plastocyanin (Pc) plays a crucial role as an electron carrier and shuttle protein between two membrane protein complexes: cytochrome b(6)f (cyt b(6)f) and photosystem I (PSI). The rapid turnover of Pc between cyt b(6)f and PSI enables the efficient use of light energy. In the Pc-cyt b(6)f and Pc-PSI electron transfer complexes, the electron transfer reactions are accomplished within <10(-4) s. However, the mechanisms enabling the rapid association and dissociation of Pc are still unclear because of the lack of an appropriate method to study huge complexes with short lifetimes. Here, using the transferred cross-saturation method, we investigated the residues of spinach (Spinacia oleracea) Pc in close proximity to spinach PSI and cyt b(6)f, in both the thylakoid vesicle-embedded and solubilized states. We demonstrated that the hydrophobic patch residues of Pc are in close proximity to PSI and cyt b(6)f, whereas the acidic patch residues of Pc do not form stable salt bridges with either PSI or cyt b(6)f, in the electron transfer complexes. The transient characteristics of the interactions on the acidic patch facilitate the rapid association and dissociation of Pc.


Figures

Figure 1.
Figure 1.
Schematic Diagram of the TCS Experiments with the Pc-PSI and Pc-cyt b6f Complexes. The saturation of the interface residues of Pc is efficiently transferred to the free state. The saturation of each amide proton of unbound Pc can be observed as an intensity reduction in the 1H-15N shift correlation spectra. Therefore, the residues that are in close proximity to PSI can be identified by observations of their signal intensity reductions. [See online article for color version of this figure.]
Figure 2.
Figure 2.
TCS Experiments with Excess Amounts of Pc Relative to the PSI and cyt b6f Embedded in Inside-Out Thylakoid Vesicles. (A) Schematic diagram of the experiments. The spectra are shown in Supplemental Figure 3 online. (B) Plots of the reduction ratios of the signal intensities originating from the amide groups, with and without presaturation. Red and pink plots represent the residues with signal intensity reduction ratios >0.3 and within the 0.2 to 0.3 range, and labeled. The residues with reduction ratios <0.2 are cyan. The error bars represent the root sum square of the reciprocal of the signal-to-noise ratio of the resonances with and without irradiation. Asterisks represent the residues with intensity reduction ratios that were not determined because of low signal intensity or spectral overlap. Side chains are denoted in italics. (C) Mapping of the residues affected by the irradiation in the TCS experiments. The residues with signal intensity reduction ratios >0.3 and within the 0.2 to 0.3 range are colored red and pink, respectively. Pro residues and the residues with intensity reductions that were not determined because of low signal intensity or spectral overlap are white. In the middle view, the surface of Pc is transparent, and the copper atom and the ribbon diagram are simultaneously displayed. His-37, which is close to the copper atom, is hidden in these views. The molecular diagrams were generated with Web Lab Viewer Pro (Molecular Simulations).
Figure 3.
Figure 3.
Determination of the Interface Residues of Pc for Solubilized PSI. (A) Schematic diagram of the TCS experiments with excess amounts of Pc relative to the solubilized PSI. (B) Mapping of the residues affected by the irradiation in the TCS experiments. The plots of the reduction ratios are shown in Supplemental Figure 4A online. The labeling and coloring schemes are the same as in Figure 2.
Figure 4.
Figure 4.
Determination of the Interface Residues of Pc for Solubilized cyt b6f. (A) Schematic diagram of the experiments. (B) Mapping of the residues affected by irradiation in the TCS experiments. The plots of the reduction ratios are shown in Supplemental Figure 4B online. The labeling and coloring schemes are the same as in Figure 2. Asn-38, which is close to the copper atom, is hidden in these views.
Figure 5.
Figure 5.
Electron Transport Activities of the Wild Type and Mutant Pcs for Solubilized PSI and cyt b6f. (A) Mapping of the mutated residues on the structure of Pc. Gly-10, Ser-11, and Asn-64, which are included in the PSI binding site but not in the cyt b6f binding site, are colored red. Leu-12, the mutation of which reportedly led to diminished electron transport activity for both PSI and cyt b6f (Sigfridsson et al., 1996; Illerhaus et al., 2000), is colored green. Leu-15, Ser-48, Lys-54, and Lys-71, which are outside the binding site, are colored cyan. (B) Time course of the absorbance change at 701 nm of the solution containing 200 nM solubilized PSI and 40 nM wild-type and mutant Pcs after the flash. The traces were averaged from eight flash-photolysis experiments. (C) Time courses of the absorbance change at 421.2 minus 410.5 nm, after mixing 0.15 μM reduced and solubilized cyt b6f with 1 μM oxidized wild-type and mutant Pcs. The traces were averaged from eight stopped-flow experiments.
Figure 6.
Figure 6.
Determination of the Interface Residues of Cd-Pc for Solubilized PSI. (A) Schematic diagram of the TCS experiments with excess amounts of Cd-Pc, relative to the solubilized PSI. (B) Mapping of the residues affected by the irradiation in the TCS experiments. The plots of the reduction ratios are shown in Supplemental Figure 7 online. The labeling and coloring schemes are the same as in Figure 2.
Figure 7.
Figure 7.
Schematic Views of the Interaction Modes in the Pc-PSI and Pc-cyt b6f Complexes. The structures of spinach Pc, pea (Pisum sativum) PSI, and turnip (Brassica rapa) cyt f were manually positioned. For simplicity, only the residues of the PsaA and PsaB subunits that are within 20 Å from Trp-658-PsaA and Trp-625-PsaB and the residues of PsaF are displayed in PSI. The residues of Pc in close proximity to PSI and cyt b6f, as determined by TCS, are labeled and colored in (A) and (B), respectively, according to the same scheme as in Figure 2. Hydrophobic and basic residues that were proposed to interact with Pc in previous mutational analyses are colored green and blue, respectively, in the structures of PSI (Hippler et al., 1996, 1997, 1998; Sommer et al., 2002, 2004; Busch and Hippler, 2011) and cyt f (Soriano et al., 1996, 1998; Gong et al., 2000a). The acidic and hydrophobic patch residues of Pc are enclosed in squares. First, Pc forms a transient and loose contact with PSI and cyt b6f by electrostatic interactions between the acidic residues in Pc and the basic residues in PSI and cyt b6f. Subsequently, Pc forms an electron transfer complex with PSI and cyt b6f by hydrophobic interactions. This model suggests that the basic residues of cyt f do not affect the conformation of the Pc-cyt b6f electron transfer complex, which is consistent with the previous finding that the mutations of the basic residues of cyt f do not affect the rate of cyt f oxidation in vivo (Soriano et al., 1996, 1998) The molecular diagrams were generated with Web Lab Viewer Pro (Molecular Simulations).

References

    1. Alsallaq R., Zhou H.X. (2008). Electrostatic rate enhancement and transient complex of protein-protein association. Proteins 71: 320–335 - PMC - PubMed
    1. Amunts A., Ben-Shem A., Nelson N. (2005). Solving the structure of plant photosystem I—Biochemistry is vital. Photochem. Photobiol. Sci. 4: 1011–1015 - PubMed
    1. Amunts A., Drory O., Nelson N. (2007). The structure of a plant photosystem I supercomplex at 3.4 A resolution. Nature 447: 58–63 - PubMed
    1. Amunts A., Toporik H., Borovikova A., Nelson N. (2010). Structure determination and improved model of plant photosystem I. J. Biol. Chem. 285: 3478–3486 - PMC - PubMed
    1. Andersson B. (1986). Characterization of the thylakoid membrane by subfractionation analyses. Methods Enzymol. 118: 325–338

Publication types

MeSH terms

LinkOut - more resources