Comparative Study
. 2012 Oct 30;53(11):7412-20.
doi: 10.1167/iovs.12-10515.

The shape of the ganglion cell plus inner plexiform layers of the normal human macula

Affiliations
Comparative Study

The shape of the ganglion cell plus inner plexiform layers of the normal human macula

Robert W Knighton et al. Invest Ophthalmol Vis Sci. .

Abstract

Purpose: To use surfaces generated by two-dimensional penalized splines (2D P-splines) to characterize the shape of the macular ganglion cell plus inner plexiform layers (GCL+IPL) in a group of normal humans.

Methods: Macular images of the right eyes of 23 normal subjects ranging in age from 18 to 75 years were obtained with spectral-domain optical coherence tomography (SD-OCT). The thickness of GCL+IPL was determined by manual segmentation, areas with blood vessels were removed, and the resulting maps were fit by smooth surfaces in polar coordinates centered on the fovea.

Results: Smooth surfaces based on 2D P-splines could precisely represent GCL+IPL thickness data, with errors comparable to the axial resolution of the SD-OCT instrument. Metrics were developed for the size, shape, and slope of the edge of the foveal depression and size and shape of the surrounding macular ridge. The slope of the foveal edge was negatively correlated with foveal size (r = -0.60). The size of the macular ridge was positively correlated with foveal size (r = 0.75), with a slope near unity (0.90 ± 0.18). The centroids of the foveal edge and macular ridge clustered near the foveal center. The foveal edge and macular ridge were well fit by ellipses. The mean GCL+IPL thickness formed an elliptical annulus elongated by approximately 30% in the horizontal direction.

Conclusions: The methods developed here provide precise characterization of retinal layers for the study of glaucoma, foveal development, and other applications.


Conflict of interest statement

Disclosure: R.W. Knighton, Carl Zeiss Meditec, Inc. (C), P; G. Gregori, Carl Zeiss Meditec, Inc. (F), P

Figures

Figure 1.
Figure 1.
Layer segmentations (red lines) of a 6-mm-long horizontal B-scan through the fovea. ILM, inner limiting membrane; NFL, outer margin of the retinal nerve fiber layer; IPL, outer margin of the inner plexiform layer; IS/OS, inner edge of the junction between photoreceptor inner and outer segments; RPE, retinal pigment epithelium. The yellow circle indicates the foveal center.
Figure 2.
Figure 2.
Three representations of GCL+IPL thickness for a right eye. The yellow cross in each image marks the point of maximum OS length, which is assumed to be the foveal center. (A) Original thickness data from a 512 × 128 macular scan covering a 6 × 6 mm retinal area. Black areas contain no data. (B) A smooth surface fit to the data in Cartesian coordinates. The contour interval is 10 μm, with every other contour labeled. (C) A smooth surface fit to the data in polar coordinates centered on the fovea. Horizontal and vertical polar meridians are labeled at the image edge. The nasal and temporal edges of the image are marked N and T, respectively. Blue shading indicates areas of data that are not represented.
Figure 3.
Figure 3.
Profiles of GCL+IPL thickness along four radial meridians from the foveal center, two horizontal (A, D) and two vertical (B, C). The red lines show radial cuts through the smooth polar representation in Figure 2C and the black dots show the underlying data in Figure 2A. The arrows indicate the steeply rising foveal edge.
Figure 4.
Figure 4.
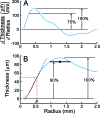
Measurement of the rising edge of the fovea and the macular ridge on one meridian. (A) The derivative of the smooth profile in Figure 3D with the region defining the foveal edge marked by a red bar. (B) The profile from Figure 3D with the foveal edge marked in red. The slope of the foveal edge was defined by a linear fit to points on the edge (dashed line). The radial location of the 50-μm contour is marked with a dotted line and arrow. The parafoveal (macular) ridge is indicated by the horizontal black bar and its radial location by the black dot.
Figure 5.
Figure 5.
Measures of the foveal edge as a function of meridian for 23 normal right eyes. The solid lines are population means; the dotted lines show ±1 SD. (A) Slope. (B) Thickness at the midpoint. The dashed line is at 50 μm. (C) Radius of the central 50-μm contour line.
Figure 6.
Figure 6.
The slope of the foveal edge was negatively correlated with foveal size. Each point is one eye. The dashed line was fit by linear regression.
Figure 7.
Figure 7.
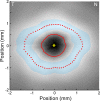
Central 4 × 4 mm of the GCL+IPL thickness surface in Figure 2C with foveal and macular features superimposed. Solid red curve: location of the foveal edge. Pale blue band: the region that exceeds 90% of the peak for each radial profile. Dotted red curve: location of the macular ridge. Yellow cross: foveal center. Yellow circle: centroid of the foveal edge. Yellow dot: centroid of the macular ridge.
Figure 8.
Figure 8.
The centroids of the foveal edge (blue) and macular ridge (red) relative to the foveal center (black cross).
Figure 9.
Figure 9.
The sizes of the foveal edge and macular ridge were positively correlated. Each symbol represents one eye and plots the averages over all meridians of the foveal and macular radii. The open circles labeled a–g correspond to the eyes in (AG) of Figure 10. The × denotes the eye shown in Figures 2 and 7. The dashed line was fit by linear regression.
Figure 10.
Figure 10.
Ellipses fit to the shapes of the foveal edge and macular ridge. In (AG) the scale is given by the 1 mm calibration bar in (G) and Ef, Em are the elongation factors for the foveal and macular ellipses, respectively. The small dots are values calculated from the GCL+IPL surfaces and the red lines are fitted ellipses. For clarity only half of the calculated points are shown for the foveal edge. The foveal center is denoted by a cross. (A) Largest macula; (B) medium fovea, large macula; (C) medium fovea, medium macula; (D) medium fovea, small macula; (E) smallest macula; (F) smallest fovea; (G) largest fovea, which also had an unusual vertical orientation. (H) Elongation factors and tilt direction for all 23 foveal edges and macular ridges. For each ellipse a line extends in both directions from the origin in the direction of tilt. The length of this line is equal to twice the elongation factor. The arrow indicates the nearly vertically oriented ellipse fitted to the foveal edge of the eye in (G).
Figure 11.
Figure 11.
The mean GCL+IPL thickness of 23 normal right eyes. (A) Mean map created by averaging the smooth fits in polar coordinates. The contour interval is 10 μm, with every other contour labeled. The dashed square outlines the enlarged area in (B). (B) The central 4 × 4 mm of the mean map showing the locations of the foveal edge, macular ridge, and their centroids as in Figure 7. Black lines: best-fitting ellipses.
Figure A1.
Figure A1.
Spatial relationship of the quantities used to fit a smooth surface to a data array. The red contours show one 2D basis function formed by the tensor product of two B-splines (red curves) along the two dimensions of the data array. The symbols along the rows and columns are used in the text. m, n: dimensions of the data array; K, L: dimensions of the coefficient array; , B: B-spline matrices; , Dd: difference operators of order , d; λ̆, λ: penalty weights. In this illustration K = 11 and L = 13.

References

    1. Gabriele ML, Wollstein G, Ishikawa H, et al. Optical coherence tomography: history, current status, and laboratory work. Invest Ophthalmol Vis Sci. 2011;52:2425–2436 - PMC - PubMed
    1. Springer AD, Hendrickson AE. Development of the primate area of high acuity. 1. Use of finite-element analysis models to identify mechanical variables affecting pit formation. Vis Neurosci. 2004;21:53–62 - PubMed
    1. Springer AD, Hendrickson AE. Development of the primate area of high acuity. 2. Quantitative morphological changes associated with retina and pars plana growth. Vis Neurosci. 2004;21:775–790 - PubMed
    1. Springer AD, Hendrickson AE. Development of the primate area of high acuity. 3. Temporal relationships between pit formation, retinal elongation and cone packing. Vis Neurosci. 2005;22:171–185 - PubMed
    1. Garvin MK, Abramoff MD, Wu X, Russell SR, Burns TL, Sonka M. Automated 3-D intraretinal layer segmentation of macular spectral-domain optical coherence tomography images. IEEE Trans Med Imaging. 2009;28:1436–1447 - PMC - PubMed

Publication types