. 2012 Oct 16;109(42):16835-40.
doi: 10.1073/pnas.1214890109. Epub 2012 Oct 2.

Role of protons in sugar binding to LacY

Affiliations

Role of protons in sugar binding to LacY

Irina Smirnova et al. Proc Natl Acad Sci U S A. .

Abstract

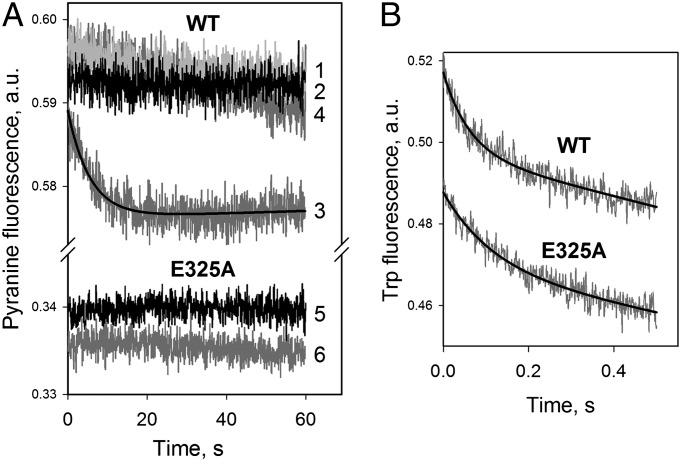
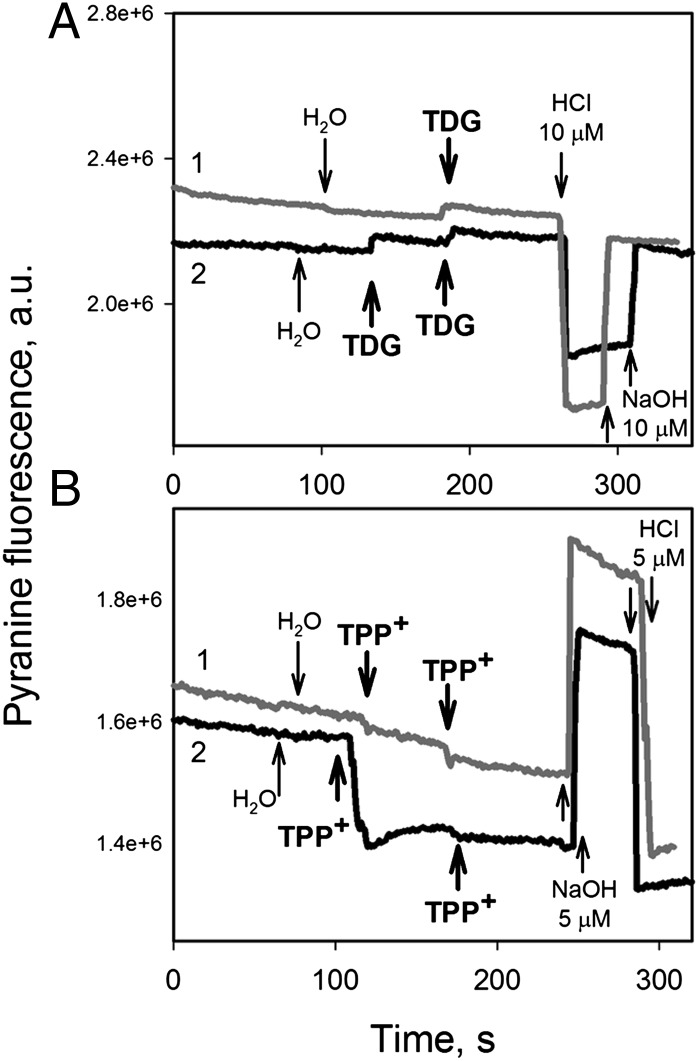
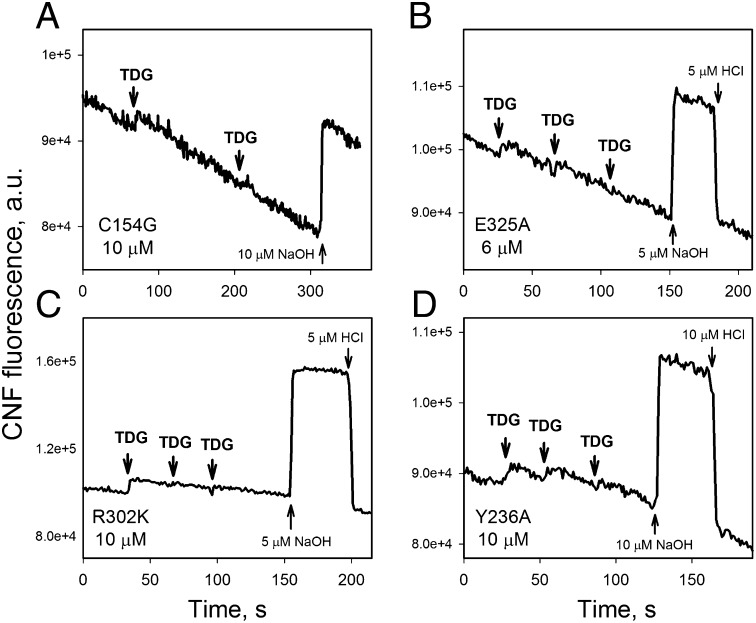
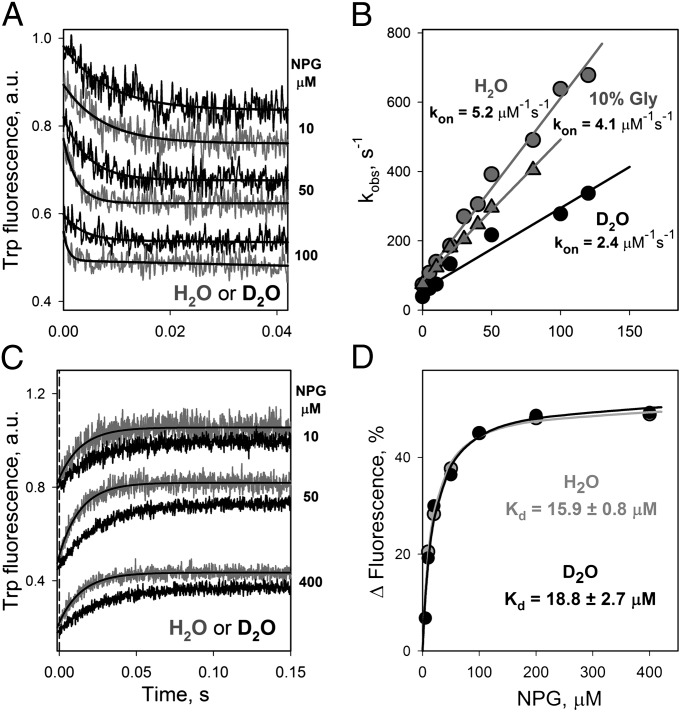
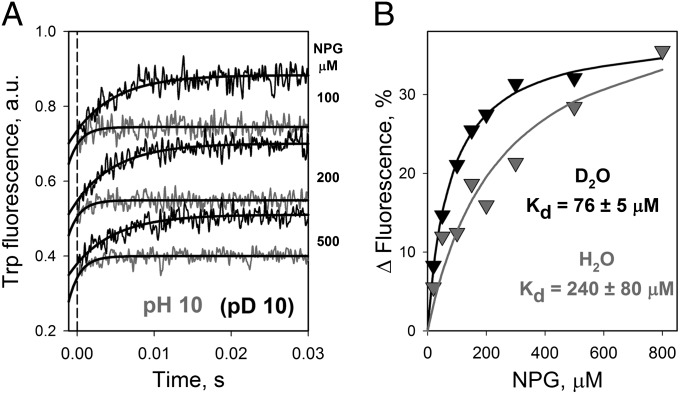
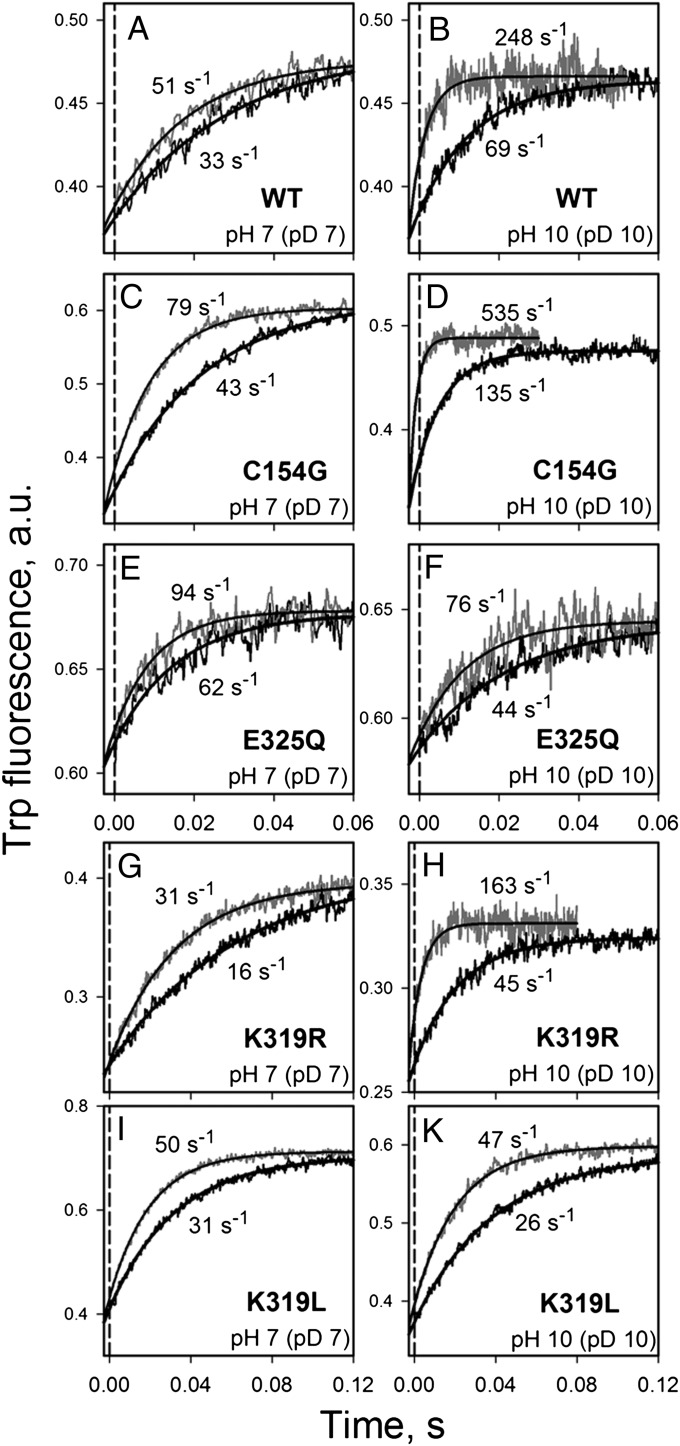
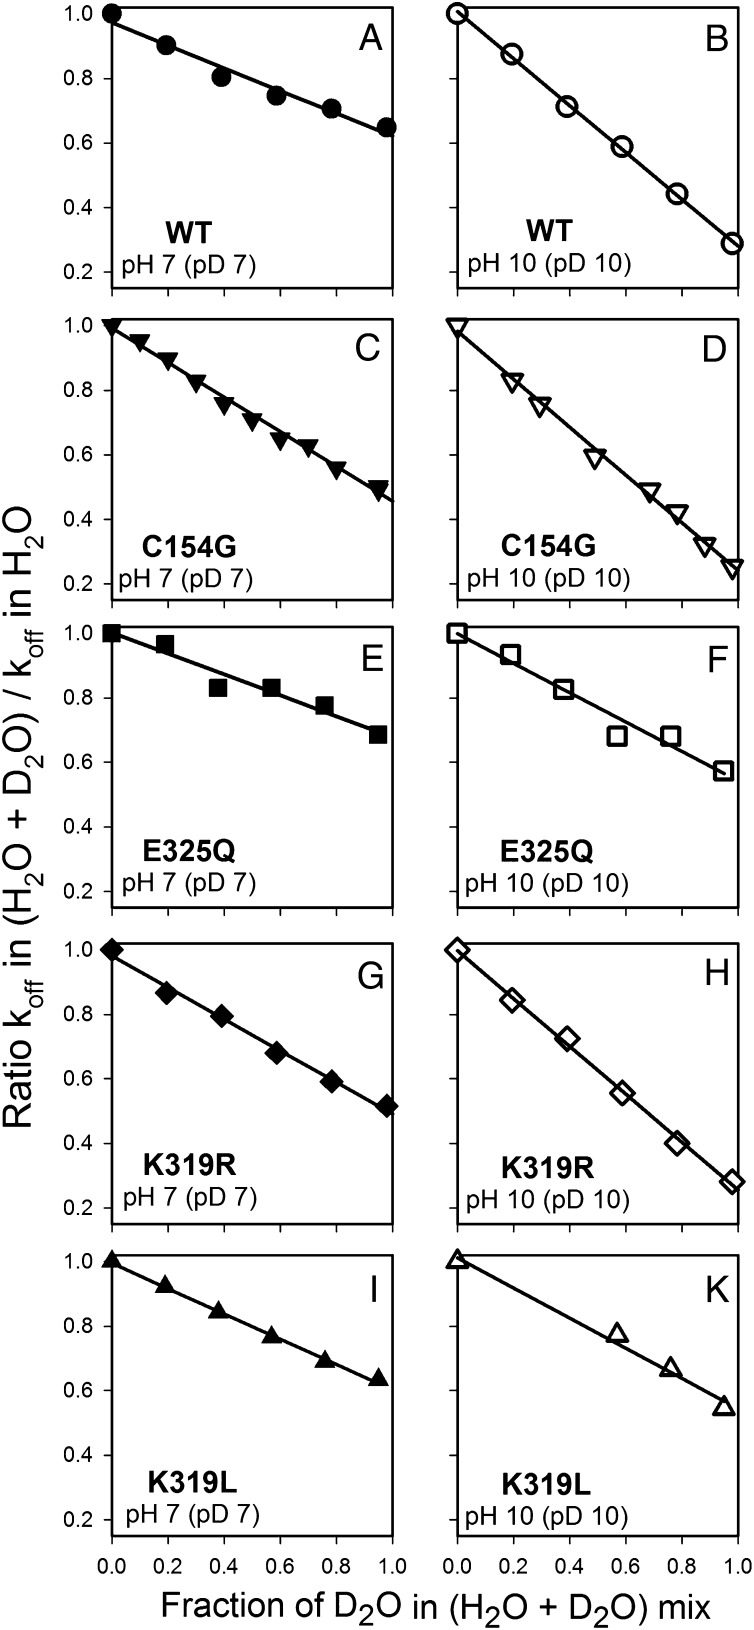
WT lactose permease of Escherichia coli (LacY) reconstituted into proteoliposomes loaded with a pH-sensitive fluorophore exhibits robust uphill H(+) translocation coupled with downhill lactose transport. However, galactoside binding by mutants defective in lactose-induced H(+) translocation is not accompanied by release of an H(+) on the interior of the proteoliposomes. Because the pK(a) value for galactoside binding is ∼10.5, protonation of LacY likely precedes sugar binding at physiological pH. Consistently, purified WT LacY, as well as the mutants, binds substrate at pH 7.5-8.5 in detergent, but no change in ambient pH is observed, demonstrating directly that LacY already is protonated when sugar binds. However, a kinetic isotope effect (KIE) on the rate of binding is observed, indicating that deuterium substitution for protium affects an H(+) transfer reaction within LacY that is associated with sugar binding. At neutral pH or pD, both the rate of sugar dissociation (k(off)) and the forward rate (k(on)) are slower in D(2)O than in H(2)O (KIE is ∼2), and, as a result, no change in affinity (K(d)) is observed. Alkaline conditions enhance the effect of D(2)O on k(off), the KIE increases to 3.6-4.0, and affinity for sugar increases compared with H(2)O. In contrast, LacY mutants that exhibit pH-independent high-affinity binding up to pH 11.0 (e.g., Glu325 → Gln) exhibit the same KIE (1.5-1.8) at neutral or alkaline pH (pD). Proton inventory studies exhibit a linear relationship between k(off) and D(2)O concentration at neutral and alkaline pH, indicating that internal transfer of a single H(+) is involved in the KIE.


Conflict of interest statement

The authors declare no conflict of interest.

Figures

Fig. 1.
Fig. 1.
Influx of H+ into proteoliposomes by symport with lactose. Stopped-flow traces were recorded after mixing proteoliposomes with a given sugar. (A) WT LacY (four upper traces) or E325A mutant (two lower traces) was reconstituted in proteoliposomes, loaded with 0.6 mM pyranine, and mixed with sucrose (trace 1), lactose (traces 3, 4, and 6), or buffer only (traces 2 and 5). To block sugar binding, proteoliposomes with WT LacY were preincubated with 10 mM N-ethylmaleimide for 10 min before mixing with lactose (trace 4). The sugar concentration after mixing was 12 mM, and the final protein concentration was ∼0.5 μM in 5 mM KPi/100 mM KCl (pH 7.5) with 1 μM valinomycin. The excitation wavelength for pyranine was 450 nm, and emitted light was collected with a long-pass filter at 475 nm. (B) Direct detection of sugar binding to WT LacY and E325A mutant by Trp151→NPG FRET. Stopped-flow traces of the decrease in Trp fluorescence were recorded after mixing proteoliposomes with NPG (100 μM, final concentration). Buffer content and proteoliposomes (without pyranine) are the same as in A. The excitation wavelength was 295 nm, and emitted light was collected with a long-pass filter at 320 nm. Single-exponential fits are shown as black lines with estimated rates of 16.3 ± 0.6 s−1 and 8.6 ± 0.5 s−1 for WT LacY and mutant E325A, respectively.
Fig. 2.
Fig. 2.
Changes in pH induced by substrate binding to LacY or EmrE in detergent. Fluorescence of pyranine (40 nM) was recorded continuously at excitation and emission wavelengths of 450 and 510 nm, respectively, in unbuffered solution containing a given protein (black traces, 2) or solution with no protein (gray traces, 1). Additions are indicated by arrows. (A) Changes in pyranine fluorescence after the addition of TDG (5 mM) to 100 mM NaCl/0.02% DDM without protein (gray trace) or containing 10 μM LacY (black trace). The starting point corresponds to pH 7.4. Additions of 10 μM HCl or NaOH were made to quantify the shift in fluorescence intensity caused by the change in H+ concentration. (B) Changes in pyranine fluorescence after the addition of 40 μM TPP+ to 100 mM NaCl/0.08% DDM solution without protein (gray trace), or with 4 μM EmrE (60 μg/mL) (black trace). The starting point corresponds to pH 7.2. Additions of 5 μM HCl or NaOH were made to quantify the shift in fluorescence intensity caused by the change in H+ concentration. Estimated proton release triggered by TPP+ binding is 0.7 mol/mol of EmrE monomer.
Fig. 3.
Fig. 3.
Effect of substrate binding to LacY mutants on pH in solution detected by CNF fluorescence. Fluorescence of CNF (1 μM) was recorded continuously at excitation and emission wavelengths of 600 and 665 nm, respectively, in unbuffered solution (100 mM NaCl/0.02% DDM) containing protein. The starting pH was 8.1–8.3. Additions of TDG (5 mM), NaOH, and HCl are indicated by arrows. Protein concentrations were 10 μM C154G (A), 6 μM E325A (B), 10 μM R302K (C), and 10 μM Y236A (D). All proteins bind galactosides well, as determined by Trp151→NPG FRET (Fig. S4 EH).
Fig. 4.
Fig. 4.
Effect of D2O on sugar binding to LacY. Pre–steady-state kinetics of NPG binding to C154G LacY was measured by stopped flow as Trp151→NPG FRET with excitation at 295 nm using an emission long-pass filter at 320 nm. The final protein concentration was 0.5 μM. The buffer (25 mM NaPi/100 mM NaCl/0.02% DDM) was prepared in H2O, 10% glycerol, or D2O with pH (pD) adjusted to 7.0 (pD = pH + 0.4). (A) Stopped-flow traces recorded after mixing of protein with NPG at the given final concentrations in H2O (gray traces) or D2O (black traces). Single-exponential fits are shown as solid black lines. (B) Dependence of rates measured as shown in A in H2O (gray circles), 10% glycerol (gray triangles), or D2O (black circles) on NPG concentration. The kon values estimated from linear fits are 5.2 ± 0.1, 4.1 ± 0.1, and 2.4 ± 0.1 μM s−1 in H2O, 10% glycerol, and D2O, respectively. (C) Stopped-flow traces recorded after mixing 15 mM TDG (final concentration) and LacY preincubated with NPG at given concentrations in H2O (gray traces) or D2O (black traces). Single-exponential fits are shown as solid black lines. The estimated koff values are 70.3 ± 1.4 and 39.7 ± 1.2 s−1 in H2O and D2O, respectively. The vertical dashed line indicates dead-time of the instrument (1.5 ms). (D) NPG-binding affinity in H2O or D2O determined from the concentration dependence of the fluorescence change estimated from single-exponential fits as shown in C. The relative change in fluorescence at each NPG concentration is calculated as the percentage of the final fluorescence level after displacement of NPG by an excess of TDG. Data obtained in H2O and D2O are presented as gray and back symbols, respectively. Kd values estimated from hyperbolic fits are 15.9 ± 0.8 and 18.8 ± 2.7 μM in H2O and D2O, respectively.
Fig. 5.
Fig. 5.
Effect of D2O on sugar binding to LacY at pH 10.0. Pre–steady-state kinetics of NPG displacement was determined for C154G LacY by stopped-flow measurements of Trp151→NPG FRET at an excitation wavelength of 295 nm with an emission long-pass filter of 320 nm. The final protein concentration was 0.5 μM in 25 mM CAPS/100 mM NaCl/0.02% DDM at a pH (pD) of 10.0 (pD = pH + 0.4). (A) Stopped-flow traces recorded after mixing of 15 mM TDG (final concentration) and protein preincubated with NPG at given concentrations in H2O (gray traces) or D2O (black traces). Single-exponential fits are shown as solid black lines. The estimated koff values are 680 ± 101 and 188 ± 28 s−1 in H2O or D2O, respectively. The dashed broken line indicates dead time of the instrument (1.2 ms). (B) NPG-binding affinity in H2O or D2O is determined from the dependence of the fluorescence changes on NPG concentration as described in Fig. 4D. The relative change in fluorescence at each NPG concentration was calculated as a percentage of the final fluorescence level after displacement of NPG by an excess of TDG. Data obtained in H2O and D2O are presented as gray and black triangles, respectively. Kd values estimated from hyperbolic fits are 240 ± 80 and 76 ± 5 μM in H2O and D2O, respectively.
Fig. 6.
Fig. 6.
Effect of D2O on the NPG dissociation rate (koff) at neutral or alkaline pH (pD). Rates of displacement of bound NPG by an excess of TDG were determined by measuring Trp151→NPG FRET at excitation and emission wavelengths of 295 and 330 nm, respectively. Stopped-flow rates were measured in H2O (gray traces) and D2O (black traces). Final concentrations were 1 μM protein, 100 μM NPG, and 6 mM TDG. The buffers (25 mM NaPi or CAPS with 100 mM NaCl/0.02% DDM) were prepared in H2O or D2O with pH (pD) adjusted to 7.0 or 10.0 (pD = pH + 0.4). The vertical dashed line indicates dead-time of the instrument (2.7 ms). The rates estimated from single-exponential fits are given. Data are shown for WT LacY (A and B) and mutants C154G (C and D), E325Q (E and F), K319R (G and H), and K319L (I and K). Panels on the left show traces recorded at pH (pD) 7.0, and panels on the right show traces for pH (pD) 10. The estimated KIE for each protein is shown in Table 1.
Fig. 7.
Fig. 7.
Proton inventory at neutral and alkaline pH (pD). Stopped-flow rates were measured as described in Fig. 6 at given concentrations of D2O. The ratio of displacement rate measured in the mixture of H2O + D2O to the displacement rate measured in H2O is plotted versus the D2O concentration. Data are presented for WT LacY (A and B) and mutants C154G (C and D), E325Q (E and F), K319R (G and H), and K319L (I and K). Panels on the left (filled symbols) show data for pH (pD) 7.0; panels on the right (open symbols) show data for pH (pD) 10.0.

References

    1. Abramson J, et al. Structure and mechanism of the lactose permease of Escherichia coli. Science. 2003;301:610–615. - PubMed
    1. Mirza O, Guan L, Verner G, Iwata S, Kaback HR. Structural evidence for induced fit and a mechanism for sugar/H+ symport in LacY. EMBO J. 2006;25:1177–1183. - PMC - PubMed
    1. Guan L, Mirza O, Verner G, Iwata S, Kaback HR. Structural determination of wild-type lactose permease. Proc Natl Acad Sci USA. 2007;104:15294–15298. - PMC - PubMed
    1. Chaptal V, et al. Crystal structure of lactose permease in complex with an affinity inactivator yields unique insight into sugar recognition. Proc Natl Acad Sci USA. 2011;108:9361–9366. - PMC - PubMed
    1. Frillingos S, Sahin-Tóth M, Wu J, Kaback HR. Cys-scanning mutagenesis: A novel approach to structure function relationships in polytopic membrane proteins. FASEB J. 1998;12:1281–1299. - PubMed

Publication types

MeSH terms

LinkOut - more resources