. 2012;9(12):681-90.
doi: 10.1080/15459624.2012.725986.

Dispersion and exposure to a cough-generated aerosol in a simulated medical examination room

Affiliations

Dispersion and exposure to a cough-generated aerosol in a simulated medical examination room

William G Lindsley et al. J Occup Environ Hyg. 2012.

Erratum in

  • Correction: J Occup Environ Hyg.2012;9(12):681-90.
    Lindsley WG, King WP, Thewlis RE, Reynolds JS, Panday K, Cao G, Szalajda JV. Lindsley WG, et al. J Occup Environ Hyg. 2013;10(2):D25. doi: 10.1080/15459624.2013.750545. J Occup Environ Hyg. 2013. PMID: 23259775 No abstract available.

Abstract

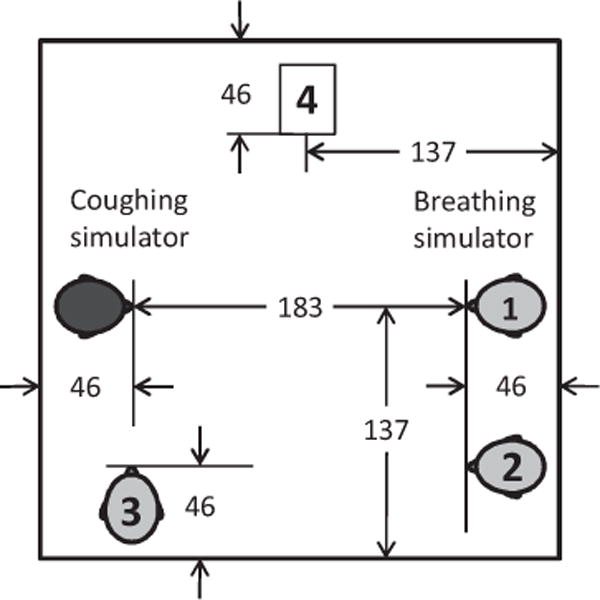
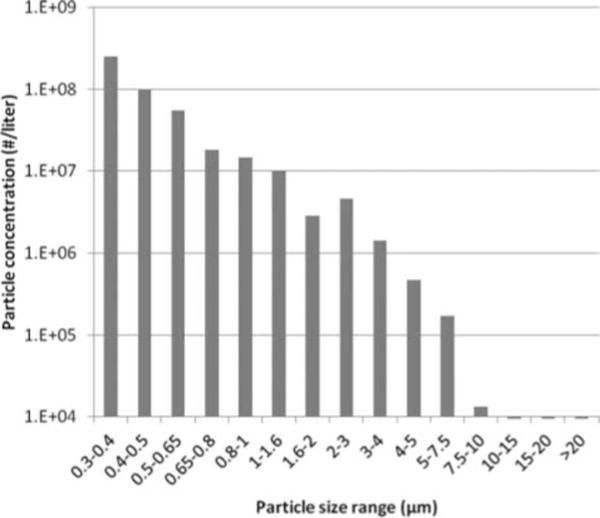
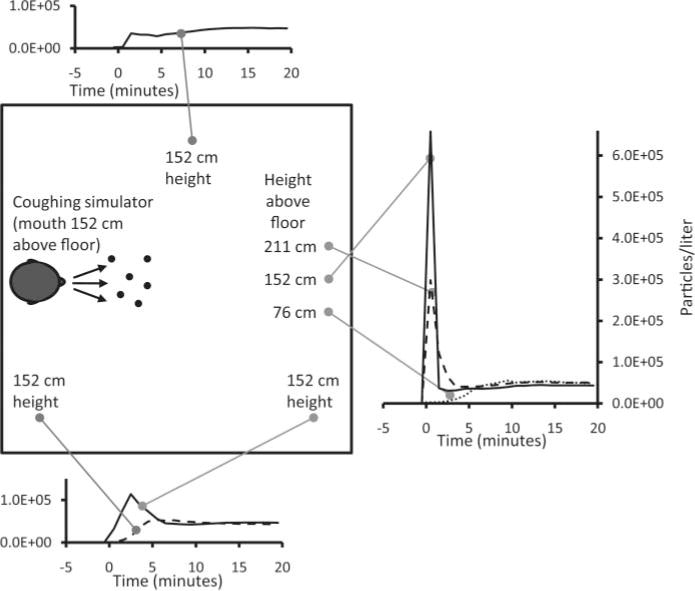
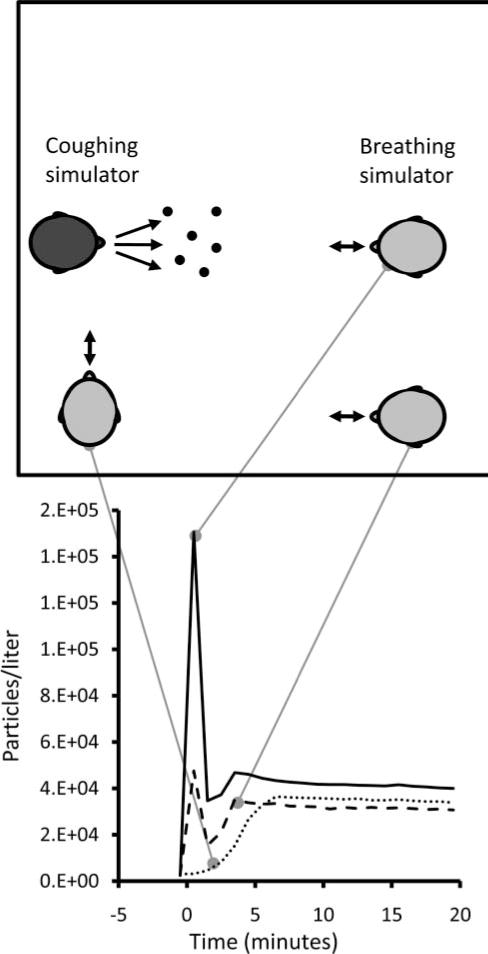
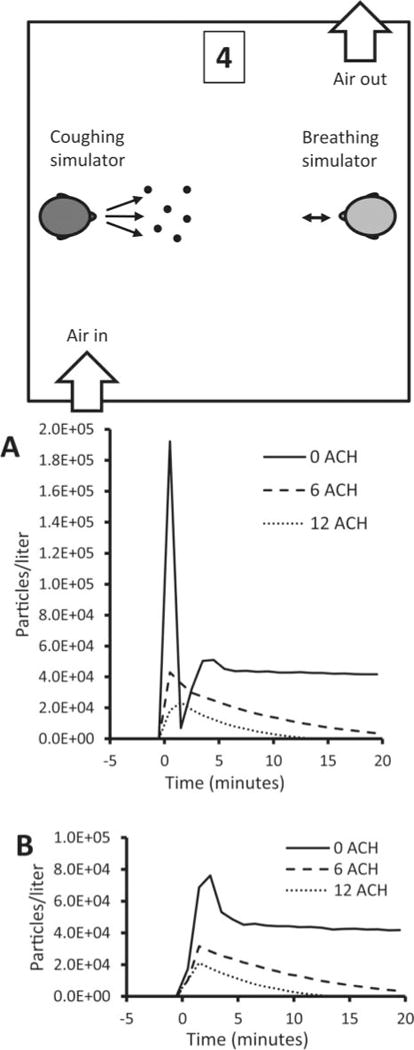
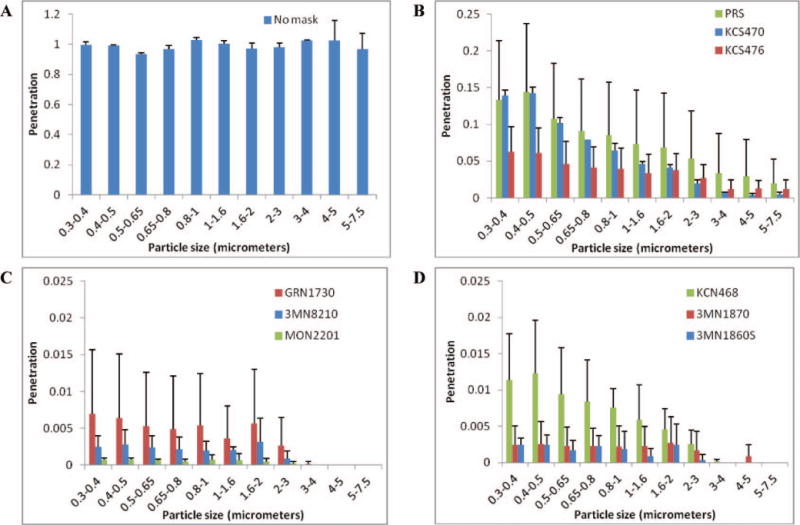
Few studies have quantified the dispersion of potentially infectious bioaerosols produced by patients in the health care environment and the exposure of health care workers to these particles. Controlled studies are needed to assess the spread of bioaerosols and the efficacy of different types of respiratory personal protective equipment (PPE) in preventing airborne disease transmission. An environmental chamber was equipped to simulate a patient coughing aerosol particles into a medical examination room, and a health care worker breathing while exposed to these particles. The system has three main parts: (1) a coughing simulator that expels an aerosol-laden cough through a head form; (2) a breathing simulator with a second head form that can be fitted with respiratory PPE; and (3) aerosol particle counters to measure concentrations inside and outside the PPE and at locations throughout the room. Dispersion of aerosol particles with optical diameters from 0.3 to 7.5 μm was evaluated along with the influence of breathing rate, room ventilation, and the locations of the coughing and breathing simulators. Penetration of cough aerosol particles through nine models of surgical masks and respirators placed on the breathing simulator was measured at 32 and 85 L/min flow rates and compared with the results from a standard filter tester. Results show that cough-generated aerosol particles spread rapidly throughout the room, and that within 5 min, a worker anywhere in the room would be exposed to potentially hazardous aerosols. Aerosol exposure is highest with no personal protective equipment, followed by surgical masks, and the least exposure is seen with N95 FFRs. These differences are seen regardless of breathing rate and relative position of the coughing and breathing simulators. These results provide a better understanding of the exposure of workers to cough aerosols from patients and of the relative efficacy of different types of respiratory PPE, and they will assist investigators in providing research-based recommendations for effective respiratory protection strategies in health care settings.


Figures

FIGURE 1
FIGURE 1
Chamber to simulate exposure of a health care worker to potentially infectious aerosol particles from a coughing patient. Dimensions are in cm. The mouths of the coughing and breathing simulators were located 152 cm above the floor. The breathing simulator was placed in one of the three positions (1–3) indicated on the diagram. Depending on the test, aerosol optical particle counters were located in one or more of Positions 1–4 to monitor the dispersion of the cough aerosol within the room.
FIGURE 2
FIGURE 2
Cough aerosol particle size distribution. The optical size distribution of the aerosol output from the Collison nebulizer using a 28% KCl solution. Over the measurement range of the instrument, the test aerosol had a count median diameter of 0.44 μm and a geometric standard deviation of 1.48. The aerosol particle density is 1.987 g/cm3. The optical diameter is approximately the physical diameter of the particles; because of the density of the particles, the aerodynamic diameter would be about 1.4 times the optical diameter.
FIGURE 3
FIGURE 3
Distribution of 0.3- to 0.4-μm aerosol particles after a cough. This plot shows the concentration of aerosol particles throughout the simulated examination room after a single cough at Time 0. The particle concentration over time is shown at each location for particles with an optical diameter of 0.3 to 0.4 μm. Similar results were seen for other particle sizes. The plots show the average of three experiments.
FIGURE 4
FIGURE 4
Distribution of 3- to 4-μm aerosol particles after a cough. This plot shows the concentration of aerosol particles throughout the simulated examination room after a single cough at Time 0. The plots show the average of three experiments.
FIGURE 5
FIGURE 5
Aerosol exposure at different locations in the chamber. This figure shows the concentration of 0.3- to 0.4-μm particles measured at the mouth of the breathing simulator while it was at different locations in the room. The breathing simulator was breathing at 32 L/min. Similar results were seen for other particle sizes. Each line shows the average of three experiments.
FIGURE 6
FIGURE 6
Effect of room ventilation. The concentration of 0.3- to 0.4-μm particles are shown for different room air changes/hour at (A) the mouth of the breathing simulator and (B) Location 4 at the side of the room. The air inlet was located in the ceiling while the outlet was near the floor. The breathing simulator was breathing at 32 L/min. Similar results were seen for other particle sizes. Each line shows the average of three experiments.
FIGURE 7
FIGURE 7
Aerosol penetration through PPE. The aerosol penetration was determined while breathing at 32 L/min and using (A) no PPE; (B) surgical masks; (C) N95 FFRs; and (D) N95 FFR/surgical masks. Note that the vertical scale was adjusted for each plot for clarity. Particle sizes are optical diameters. Each bar shows the average from three samples of each model of PPE. Error bars show the standard deviation.
FIGURE 8
FIGURE 8
Comparison of filter tester and breathing simulator penetration values at 32 and 85 L/min. Penetration values for all types of PPE tested in the aerosol exposure chamber correlated well with those from the filter tester. Results for the breathing simulator are for particles from 0.3 to 0.4 μm. Penetration values at each flow rate are the average of five PPE samples for the filter tester and three for the breathing simulator.

References

    1. Li Y, Leung GM, Tang JW, et al. Role of ventilation in airborne transmission of infectious agents in the built environment—A multidisciplinary systematic review. Indoor Air. 2007;17(1):2–18. - PubMed
    1. Tang JW, Li Y, Eames I, Chan PK, Ridgway GL. Factors involved in the aerosol transmission of infection and control of ventilation in health care premises. J Hosp Infect. 2006;64(2):100–114. - PMC - PubMed
    1. Siegel JD, Rhinehart E, Jackson M, Chiarello L. 2007 Guideline for isolation precautions: Preventing transmission of infectious agents in health care settings. Am J Infect Control. 2007;35(10 Suppl 2):S65–S164. - PMC - PubMed
    1. Rengasamy A, Miller A, Eimer BC, Shaffer R. Filtration performance of FDA-cleared surgical masks. J Int Soc Respir Prot. 2009;26:54–70. - PMC - PubMed
    1. Oberg T, Brosseau LM. Surgical mask filter and fit performance. Am J Infect Control. 2008;36(4):276–282. - PMC - PubMed

MeSH terms