. 2012 Oct 3;13(10):R97.
doi: 10.1186/gb-2012-13-10-r97.

Aging effects on DNA methylation modules in human brain and blood tissue

Aging effects on DNA methylation modules in human brain and blood tissue

Steve Horvath et al. Genome Biol. .

Abstract

Background: Several recent studies reported aging effects on DNA methylation levels of individual CpG dinucleotides. But it is not yet known whether aging-related consensus modules, in the form of clusters of correlated CpG markers, can be found that are present in multiple human tissues. Such a module could facilitate the understanding of aging effects on multiple tissues.

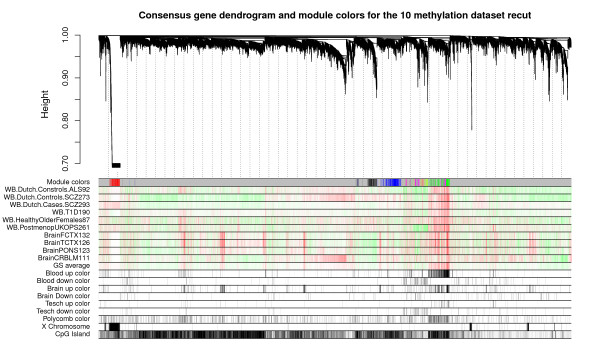
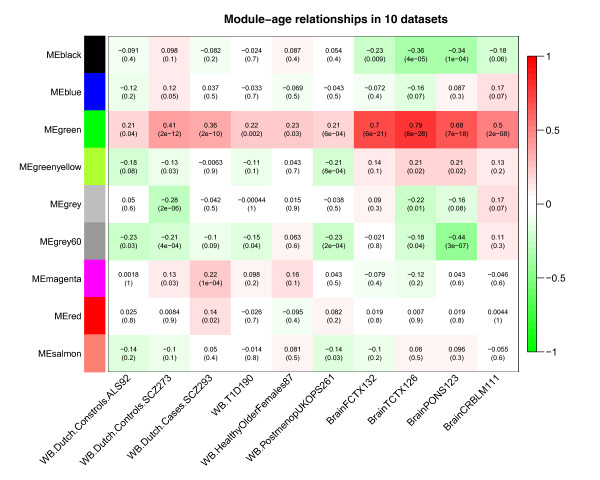
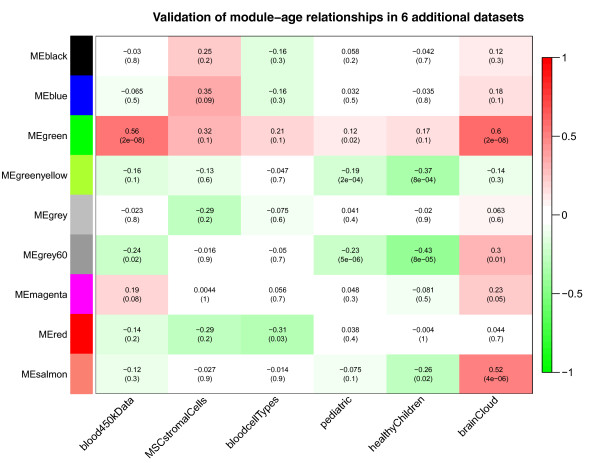
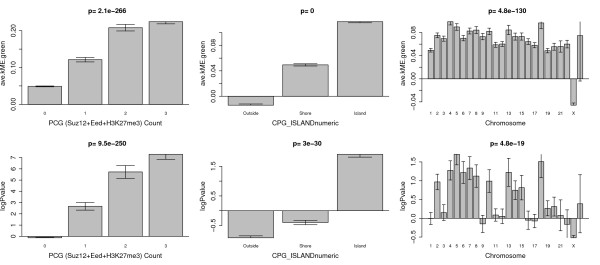
Results: We therefore employed weighted correlation network analysis of 2,442 Illumina DNA methylation arrays from brain and blood tissues, which enabled the identification of an age-related co-methylation module. Module preservation analysis confirmed that this module can also be found in diverse independent data sets. Biological evaluation showed that module membership is associated with Polycomb group target occupancy counts, CpG island status and autosomal chromosome location. Functional enrichment analysis revealed that the aging-related consensus module comprises genes that are involved in nervous system development, neuron differentiation and neurogenesis, and that it contains promoter CpGs of genes known to be down-regulated in early Alzheimer's disease. A comparison with a standard, non-module based meta-analysis revealed that selecting CpGs based on module membership leads to significantly increased gene ontology enrichment, thus demonstrating that studying aging effects via consensus network analysis enhances the biological insights gained.

Conclusions: Overall, our analysis revealed a robustly defined age-related co-methylation module that is present in multiple human tissues, including blood and brain. We conclude that blood is a promising surrogate for brain tissue when studying the effects of age on DNA methylation profiles.


Figures

Figure 1
Figure 1
Age effects on gene expression (mRNA) levels are not preserved between blood and brain tissue. (a-d) Scatterplots of mean gene expression (mRNA abundance) in whole blood of the Dutch samples (x-axis) and corresponding mean brain expression values (y-axis) for frontal cortex (FCTX) (a), temporal cortex (TCTX) (b), pons (c), and cerebellum (CRBLM) (d). Each dot corresponds to a gene. The brain mRNA data (like the brain methylation data used in this article) were obtained from [19]. Note that only moderate correlations (around r = 0.6) exist between the mean expression values of these distinct tissues. (e-g) Overall age correlations of gene expression levels (mRNA) are not preserved between blood (x-axis) and brain tissues (y axes) as evidenced by the weak negative correlations reported in the title of each panel. The mRNA levels of each gene (represented by a dot) were correlated with subject age and a linear regression model was used to calculate a correlation test P-value. The x-axis of each scatterplot shows the (signed) logarithm (base 10) of the correlation test P-value in blood. Genes with a significant positive (negative) correlation with age have a high positive (negative) log P-value. The y-axis shows the corresponding correlation test P-values in the frontal cortex (e), temporal cortex (f), pons (g), and cerebellum (h).
Figure 2
Figure 2
Age effects on DNA methylation levels are well preserved between blood and brain tissue. (a-d) Scatterplots of mean CpG methylation levels in whole blood of the Dutch samples (x-axis) and corresponding mean brain methylation values (y-axis) for frontal cortex (FCTX) (a), temporal cortex (TCTX) (b), pons (c), and cerebellum (CRBLM) (d). The brain methylation data used were obtained from [19]. Note that strong correlations (around r = 0.9) exist between the mean methylation levels in whole blood and brain tissue. We hypothesize that the relatively low correlation of r = 0.85 for cerebellum may reflect DNA quality. (e-g) Age correlations of CpG methylation levels show moderate preservation (correlations around 0.33) between blood (x-axis) and brain tissues (y axes). Analogous to Figure 1, the methylation levels of each gene (represented by a dot) were correlated with subject age and a linear regression model was used to calculate a correlation test P-value. The x-axis of each scatterplot shows the (signed) logarithm (base 10) of the correlation test P-value in blood. Genes with a significant positive (negative) correlation with age have a high positive (negative) log P-value. The y-axis shows the corresponding correlation test P-values in the frontal cortex (e), temporal cortex (f), pons (g), and cerebellum (h).
Figure 3
Figure 3
Hierarchical cluster tree and consensus module structure. Hierarchical cluster tree (dendrogram) of the consensus network based on ten independent methylation data sets. The first color band underneath the tree indicates the module color of each CpG site. The color grey is reserved for 'background' CpG sites that are not clustered into any module. The remaining color bands represent each gene's correlation with age in the underlying data sets; high intensity red values represent a strong positive correlation whereas high intensity green values represent a strong negative correlation. The remaining color bands indicate whether a gene was part of the core aging signature from Teschendorff et al. [16]. The color bands 'Tesch up' and 'Tesch down' indicate that Teschendorff et al. determined that methylation levels of this CpG site correlated positively or negatively with age, respectively. Other color bands indicate whether the CpG site is close to a known polycomb group target, is located on the X chromosome, or located in a CpG island. The figure suggests that the green module is composed of CpG sites that positively correlate with age in all ten tissues, which is why we refer to it as an aging module. Further, this aging related module is enriched with CpG sites that are close to Polycomb group target genes. Also note the presence of a very distinct red module that corresponds to CpG sites located on the X chromosome.
Figure 4
Figure 4
Correlating consensus modules with age in the ten reference data sets. Each row corresponds to a consensus co-methylation module (defined in Figure 3). More precisely, each row corresponds to the first principal component of each module (referred to as eigengene). The columns correspond to the age variable in each of the ten reference data sets. Each cell reports the correlation coefficient between the eigengene and age (top) and the corresponding P-value (bottom). Cells in the table are color coded using correlation values according to color scale on the right - that is, strong positive correlations are denoted by strong red color, and strong negative correlations by strong green color.
Figure 5
Figure 5
Correlating consensus modules with age in the six validation data sets. Each row corresponds to a consensus co-methylation module eigengene (defined in Figure 3). The columns correspond to the age variable in each of the six validation data sets. Each cell reports correlation coefficient between the eigengene and age (top) and the corresponding P-value (bottom). Cells in the table are color coded using correlation values according to color scale on the right. All of the reported modules were significantly preserved in the Dutch WB data measured on the Illumina 450 K array (Additional file 3). The green module has a particularly strong positive correlation with age in the Dutch 450 K blood data (r = 0.56, P = 2E-8) and in the brain cloud (pre-frontal cortex) data sets (r = 0.6, P = 2E-8). The age correlations for the green module are positive in all of the data sets (most of the marginally significant P-values reflect the low sample size in the respective data sets or the low age range).
Figure 6
Figure 6
Relating age relationships to chromosomal properties. The bar plots in the top row relate average module membership in the aging module (average kME with respect to the green module) to Polycomb group (PCG) occupancy count, CpG island status, and chromosomal location, respectively. The bottom row shows the corresponding bar plots involving the (signed) logarithm of the meta analysis P-value. A positive (negative) log P-value indicates a positive (negative) age correlation of the CpG site. Both age association measures lead to the following results. First, the higher the PCG occupancy count, the stronger the age association. Second, CpG sites in CpG islands tend to have positive age correlations while those outside tend to have negative age correlations. Third, CpG sites on X chromosomes tend to have lower age correlations than those on other chromosomes. While both age association measures lead to similar conclusions, the results are more pronounced for the module membership measure (average kME), which suggests that this measure leads to more meaningful biological conclusions. Error bars indicate one standard error.

References

    1. Guarente L. Do changes in chromosomes cause aging? Cell. 1996;13:9–12. doi: 10.1016/S0092-8674(00)80072-0. - DOI - PubMed
    1. Wareham KA, Lyon MF, Glenister PH, Williams ED. Age related reactivation of an X-linked gene. Nature. 1987;13:725–727. doi: 10.1038/327725a0. - DOI - PubMed
    1. Berdyshev G, Korotaev G, Boiarskikh G, Vaniushin B. Nucleotide composition of DNA and RNA from somatic tissues of humpback and its changes during spawning. Biokhimiia. 1967;13:88–993. - PubMed
    1. Bell JT, Tsai P-C, Yang T-P, Pidsley R, Nisbet J, Glass D, Mangino M, Zhai G, Zhang F, Valdes A, Shin S-Y, Dempster EL, Murray RM, Grundberg E, Hedman AK, Nica A, Small KS, Dermitzakis ET, McCarthy MI, Mill J, Spector TD, Deloukas P, The Mu TC. Epigenome-Wide Scans Identify Differentially Methylated Regions for Age and Age-Related Phenotypes in a Healthy Ageing Population. PLoS Genet. 2012;13:e1002629. doi: 10.1371/journal.pgen.1002629. - DOI - PMC - PubMed
    1. Wilson V, Jones P. DNA methylation decreases in aging but not in immortal cells. Science. 1983;13:1055–1057. doi: 10.1126/science.6844925. - DOI - PubMed

Publication types