

doi: 10.1186/gb-2012-13-10-r83.
BSmooth: from whole genome bisulfite sequencing reads to differentially methylated regions
- PMID: 23034175
- PMCID: PMC3491411
- DOI: 10.1186/gb-2012-13-10-r83
Item in Clipboard
BSmooth: from whole genome bisulfite sequencing reads to differentially methylated regions
Genome Biol.
.
Abstract
DNA methylation is an important epigenetic modification involved in gene regulation, which can now be measured using whole-genome bisulfite sequencing. However, cost, complexity of the data, and lack of comprehensive analytical tools are major challenges that keep this technology from becoming widely applied. Here we present BSmooth, an alignment, quality control and analysis pipeline that provides accurate and precise results even with low coverage data, appropriately handling biological replicates. BSmooth is open source software, and can be downloaded from http://rafalab.jhsph.edu/bsmooth.
Figures
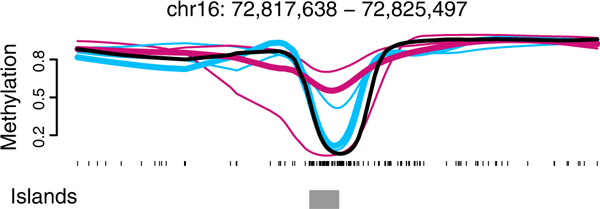
The need for biological replicates. We show smoothed methylation profiles for three normal samples (blue) and matched cancers (red) from the Hansen data [1]. Also shown is the smoothed methylation profile for an IMR90 cell-line (black) from the Lister data [3]. Had we only analyzed normal-cancer pair 3 (thick lines), there would appear to be a methylation difference between cancer and normal in this genomic region. When all three cancer-normal pairs are considered, however, this region does not appear to be a cancer-specific differentially methylated region.
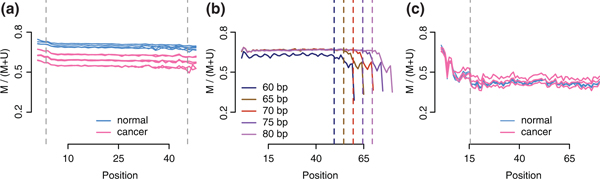
Quality control plots. (a) M-bias plot for the Hansen data, a WGBS experiment on cancer samples. Each sample was sequenced on two flowcells. We show the methylation proportion across each possible read position. This plot shows limited evidence of methylation bias across the read positions. Vertical lines indicate cutoffs used for M-bias filtering. (b) M-bias plots for the Lister data, a WGBS experiment in a fibroblast cell line. These data were aligned using iterative trimming and each read length is depicted separately (different colors). The plot shows methylation bias toward the end of reads for all read lengths. (c) M-bias plot for the Hansen-capture data, a capture bisulfite sequencing experiment on cancer samples. The plot shows methylation bias at the start of the reads.
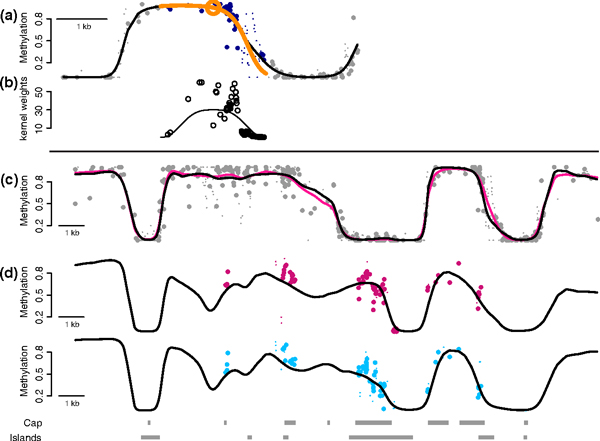
The advantages of smoothing. (a) Points represent single-CpG methylation estimates plotted against their genomic location. Large points are based on greater than 20× coverage. The orange circle denotes the location for which we are estimating the methylation profile. The blue points are those receiving positive weight in the local likelihood estimation. The orange line is obtained from the fitted parabola. The black line is the methylation profile resulting from repeating the procedure for each location. (b) The curve represents the kernel used in the weighted regression and the points are the actual weights, which are also influenced by coverage. (c) Points are as in (a) for the 25× coverage Lister data. The pink line is obtained by applying BSmooth to a the full data. The black line is the estimate from BSmooth based on a 5× subset of the Lister data. (d) The points are as in (a) but for the Hansen-capture data with average 35× coverage, and average across three replicates. The black line is the BSmooth estimate obtained from the 4× Hansen data, averaged across three replicates.
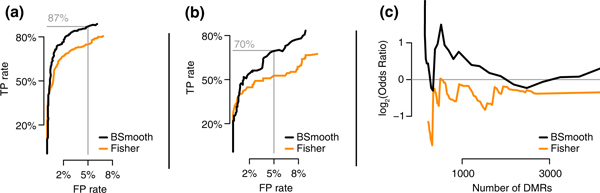
Evaluation of the differentialy methylated regions finder. (a) Specificity plotted against sensitivity for the BSmooth DMR finder (black) and a method based on Fisher's exact test (orange) applied to the Hansen data. The gold-standard definition is based on mean differences. Details are explained in the text. (b) As (a), but using a gold-standard definition accounting for biological variation. (c) Comparison based on the association between gene expression and methylation changes in the Tung data. For DMR lists of varying sizes (x-axis), the log2-odds ratios of finding a DMR within 5 kb of the transcription start site of a differentially expressed gene (FDR ≤5%) compared to genes not differentially expression (FDR ≥25%) are shown. FP, false positive; TP, true positive.
References
-
- Laird PW. Principles and challenges of genome-wide DNA methylation analysis. Nat Rev Genet. 2010;11:191. - PubMed
-
- Lister R, Pelizzola M, Dowen RH, Hawkins RD, Hon GC, Tonti-Filippini J, Nery JR, Lee L, Ye Z, Ngo QM, Edsall L, Antosiewicz-Bourget J, Stewart R, Ruotti V, Millar AH, Thomson JA, Ren B, Ecker JR. Human DNA methylomes at base resolution show widespread epigenomic differences. Nature. 2009;462:315–322. doi: 10.1038/nature08514. - DOI - PMC - PubMed
-
- Zeschnigk M, Martin M, Betzl G, Kalbe A, Sirsch C, Buiting K, Gross S, Fritzilas E, Frey B, Rahmann S, Hors- themke B. Massive parallel bisulfite sequencing of CG-rich DNA fragments reveals that methylation of many X-chromosomal CpG islands in female blood DNA is incomplete. Hum Mol Genet. 2009;18:1439–1448. doi: 10.1093/hmg/ddp054. - DOI - PubMed
Publication types
MeSH terms
Grants and funding
LinkOut - more resources
Full Text Sources
Other Literature Sources
Molecular Biology Databases
