

doi: 10.1186/gb-2012-13-10-r92.
Gel-free multiplexed reduced representation bisulfite sequencing for large-scale DNA methylation profiling
- PMID: 23034176
- PMCID: PMC3491420
- DOI: 10.1186/gb-2012-13-10-r92
Item in Clipboard
Gel-free multiplexed reduced representation bisulfite sequencing for large-scale DNA methylation profiling
Genome Biol.
.
Abstract
Sequencing-based approaches have led to new insights about DNA methylation. While many different techniques for genome-scale mapping of DNA methylation have been employed, throughput has been a key limitation for most. To further facilitate the mapping of DNA methylation, we describe a protocol for gel-free multiplexed reduced representation bisulfite sequencing (mRRBS) that reduces the workload dramatically and enables processing of 96 or more samples per week. mRRBS achieves similar CpG coverage to the original RRBS protocol, while the higher throughput and lower cost make it better suited for large-scale DNA methylation mapping studies, including cohorts of cancer samples.
Figures
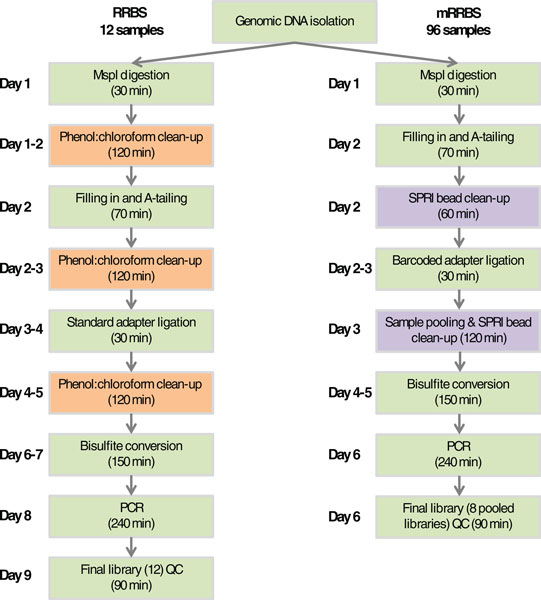
Flowchart comparing RRBS and mRRBS steps. Each step that can be completed in a standard workday is shown. Orange boxes highlight phenol:chloroform clean-up and preparative agarose gel purification steps that were omitted in the new mRRBS protocol. Purple boxes highlight key new steps specific to mRRBS. Each box also shows the approximate amount of hands-on time required per step. QC, quality control.
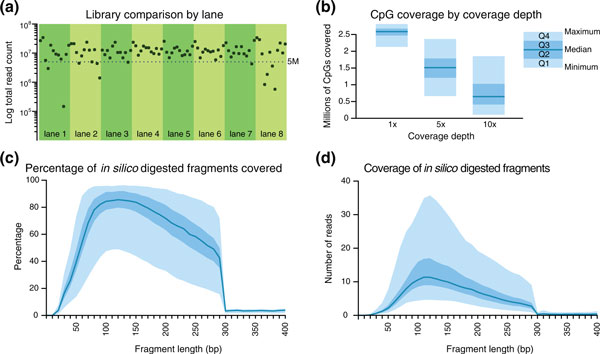
Performance summary of mRRBS. Ninety-six samples were processed using mRRBS and sequenced with eight lanes of Illumina HiSeq 2000 using 12 barcoded adapters per lane. (a) The total number of reads for each sample is shown 84 samples with >5 million total reads were included in the subsequent comparisons. (b) Quartile plots of summary coverage depth from these samples. The minimum and maximum values are bounded by the light blue area in (b-d), while the darker blue area represents the interquartile range. The dark blue line indicates the median. (c,d) MspI in silico digestion of the hg19 genome produced a total of 1,124,739 fragments. (c) The percentage of fragments of each fragment size that were covered by at least one read. (d) The average coverage depth for fragments of each length. Genomic MspI-digested fragments longer than 300 bp were not included in the sequence alignment target, which partly contributes to the sharp drop in coverage at 300 bp in (c,d).
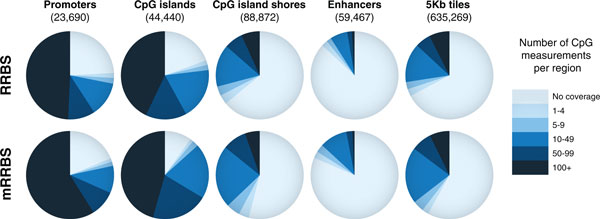
Comparison of CpG measurements in RRBS (top) and mRRBS (bottom) across five genomic features. Pie charts compare the relative CpG coverage for different genomic features as sampled by the original RRBS and mRRBS protocol. Twelve representative samples with 10 to 20 million reads and more than 10 million mapped reads were selected from each method (Table 2; Additional file 2). The number of unique CpG measurements residing within a given feature must be observed in at least 80% of the samples used to be scored at a given coverage. Promoters are defined as 1 kb upstream and 1 kb downstream of the transcription start site of Ensembl genes. CgiHunter was used to computationally derive CpG islands with a minimum CpG observed versus expected ratio of 0.6, a minimum GC content of 0.5 and a minimum length of 700 bp. CpG island shores are defined as the 2 kb regions adjacent to the derived CpG islands. Previously published H3K4me2 peaks across multiple human cells were used to derive a consensus enhancer set [20]. As a more global measurement, the genome was divided into non-overlapping consecutive 5 kb tiles, and the number of CpG measurements in each tile was analyzed.
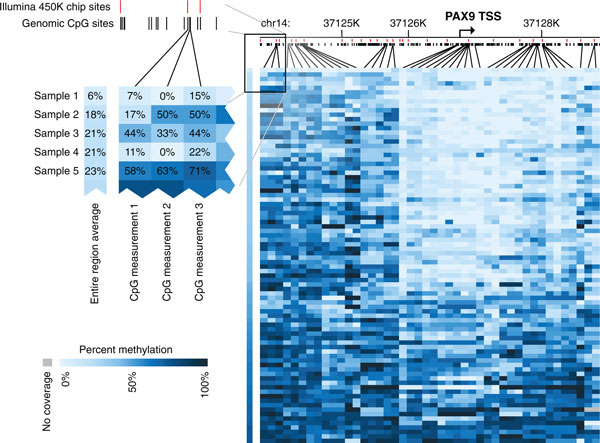
Single-base resolution view across the PAX9 locus. DNA methylation values of 44 individual CpGs that are captured at greater than 5× coverage within at least 80% of our 84 high-quality samples are shown for the region 3 kb upstream and 2 kb downstream of the PAX9 transcription start site. The 279 genomic CpGs within this region are marked in black and those captured by the Illumina Infinium HumanMethylation450 BeadChip Kit are shown in red. The regional average of these 44 CpGs is shown to the left of the individual CpG measurements for each sample.
References
Publication types
MeSH terms
Substances
Associated data
- Actions
Grants and funding
LinkOut - more resources
Full Text Sources
Other Literature Sources
Molecular Biology Databases
